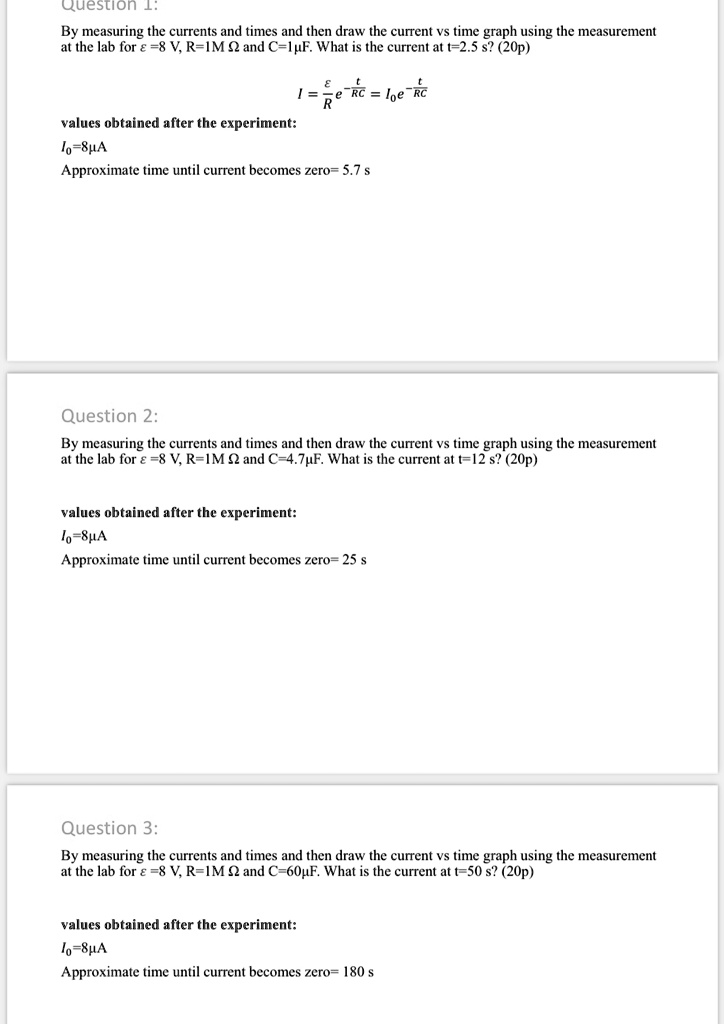
By measuring the currents and times and then draw the current vs time graph using the measurement
at the lab for ε=8V, R=1MΩ, and C=1μF. What is the current at t=2.5s? (20p)
I=(ε)/(R)e^(-(t)/(RC))=I_(0)e^(-(t)/(RC))
values obtained after the experiment:
I_(0)=8μA
Approximate time until current becomes zero = 5.7s
Question 2:
By measuring the currents and times and then draw the current vs time graph using the measurement
at the lab for ε=8V, R=1MΩ, and C=4.7μF. What is the current at t=12s? (20p)
values obtained after the experiment:
I_(0)=8μA
Approximate time until current becomes zero = 25s
Question 3:
By measuring the currents and times and then draw the current vs time graph using the measurement
at the lab for ε=8V, R=1MΩ, and C=60μF. What is the current at t=50s? (20p)
values obtained after the experiment:
I_(0)=8μA
Approximate time until current becomes zero = 180s
Question 1:
By measuring the currents and times and then draw the current vs time graph using the measurement at the lab for ε=8 V, R=1MΩ, and C=1F. What is the current at t=2.5s? (20p)
eRC=loeRC R
values obtained after the experiment:
Io=8A
Approximate time until current becomes zero = 5.7s
Question 2:
By measuring the currents and times and then draw the current vs time graph using the measurement at the lab for ε=8 V, R=1MΩ, and C=4.7F. What is the current at t=12s? (20p)
values obtained after the experiment:
Io=8A
Approximate time until current becomes zero = 25s
Question 3:
By measuring the currents and times and then draw the current vs time graph using the measurement at the lab for ε=8 V, R=1MΩ, and C=60F. What is the current at t=50s? (20p)
values obtained after the experiment:
Io=8A
Approximate time until current becomes zero = 180s