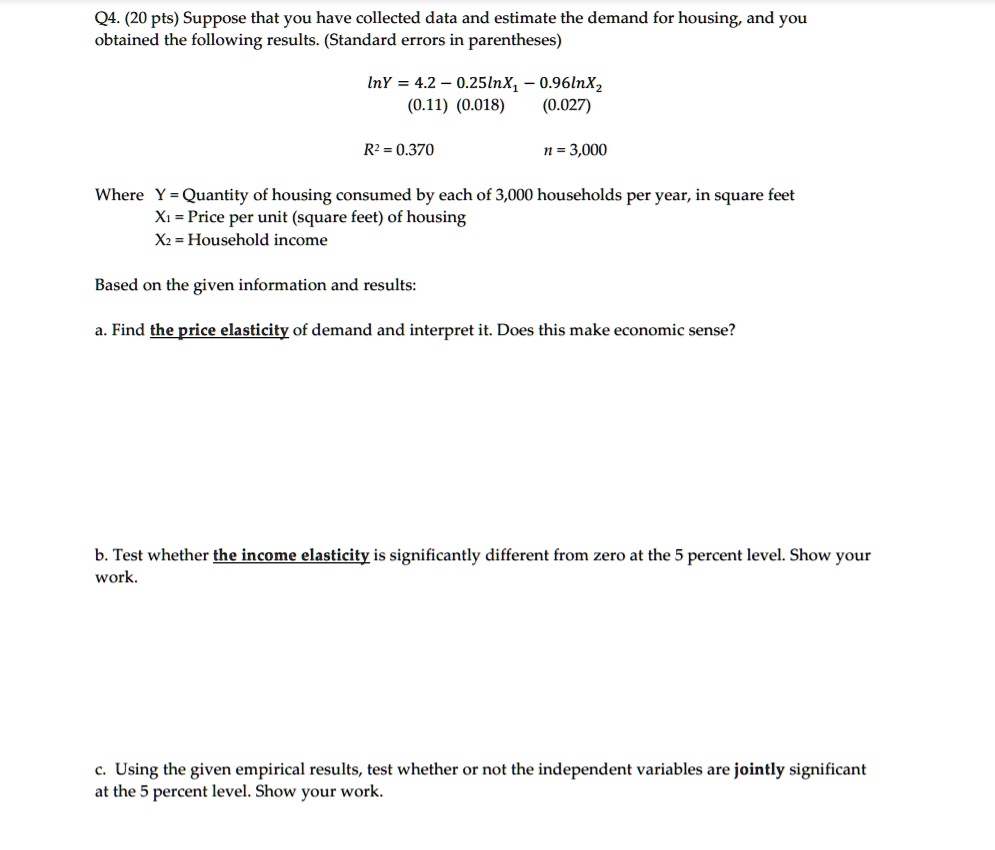
Q4. (20 pts) Suppose that you have collected data and estimate the demand for housing, and you obtained the following results. (Standard errors in parentheses)
$\ln Y = 4.2 - 0.25\ln X_1 - 0.96\ln X_2$
$(0.11) \quad (0.018) \quad (0.027)$
$R^2 = 0.370$
$n = 3,000$
Where Y = Quantity of housing consumed by each of 3,000 households per year, in square feet
$X_1$ = Price per unit (square feet) of housing
$X_2$ = Household income
Based on the given information and results:
a. Find the price elasticity of demand and interpret it. Does this make economic sense?
b. Test whether the income elasticity is significantly different from zero at the 5 percent level. Show your work.
c. Using the given empirical results, test whether or not the independent variables are jointly significant at the 5 percent level. Show your work.