Homework: Chapter 08
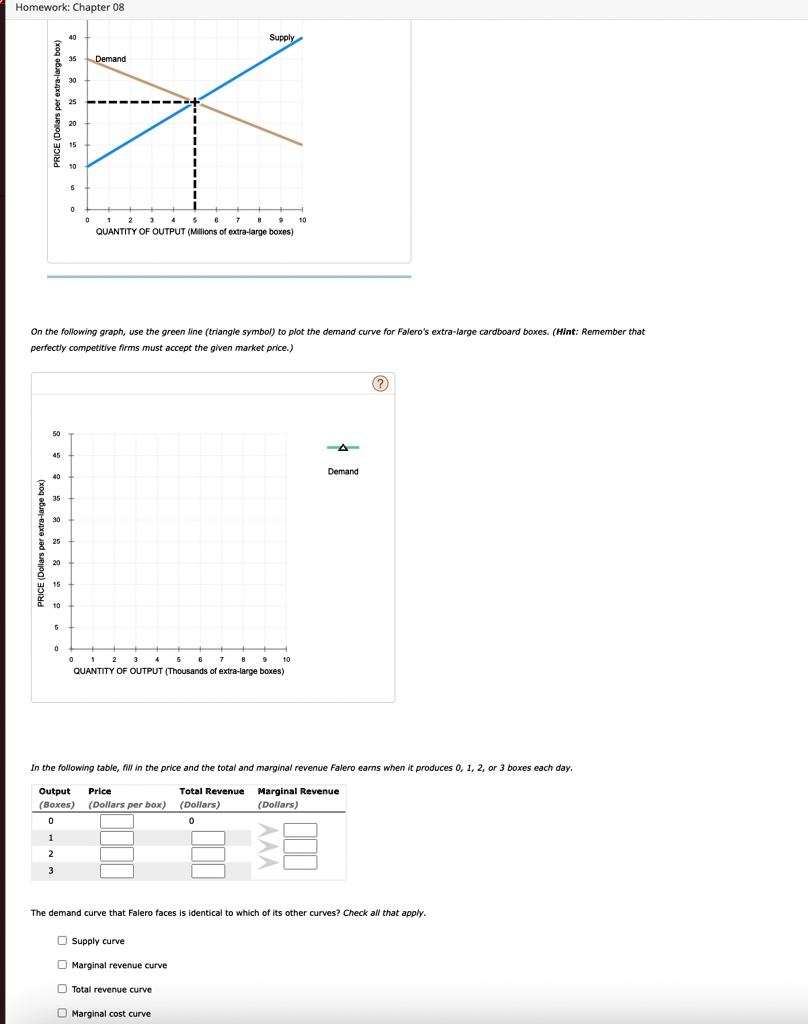
PRICE (Dollars per extra-large box)
40 35 30 25 20 15 10 5 0
Supply
Demand
QUANTITY OF OUTPUT (Millions of extra-large boxes)
On the following graph, use the green line (triangle symbol) to plot the demand curve for Falero's extra-large cardboard boxes. (Hint: Remember that
perfectly competitive firms must accept the given market price.)
PRICE (Dollars per extra-large box)
50 45 40 35 30 25 20 15 10 5 0
QUANTITY OF OUTPUT (Thousands of extra-large boxes)
Demand
In the following table, fill in the price and the total and marginal revenue Falero earns when it produces 0, 1, 2, or 3 boxes each day.
Output Price Total Revenue Marginal Revenue
(Boxes) (Dollars per box) (Dollars) (Dollars)
0
1
2
3
0
The demand curve that Falero faces is identical to which of its other curves? Check all that apply.
Supply curve
Marginal revenue curve
Total revenue curve
Marginal cost curve