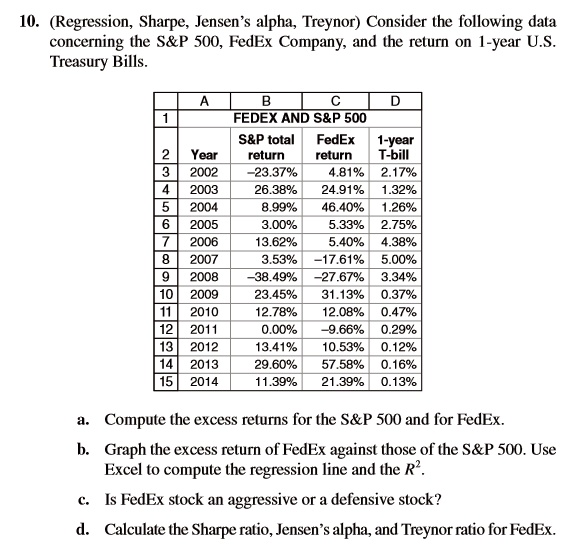
10. (Regression, Sharpe, Jensen's alpha, Treynor) Consider the following data
concerning the S&P 500, FedEx Company, and the return on 1-year U.S.
Treasury Bills.
A
B
C
D
1
FEDEX AND S&P 500
S&P total
FedEx
1-year
2 Year
return
return T-bill
3 2002
-23.37%
4.81% 2.17%
4
2003
26.38%
24.91% 1.32%
5 2004
8.99%
46.40% 1.26%
6
2005
3.00%
5.33% 2.75%
7
2006
13.62%
5.40%
4.38%
8 2007
3.53% -17.61% 5.00%
9 2008 -38.49%
-27.67% 3.34%
10
2009
23.45% 31.13% 0.37%
11 2010
12.78%
12.08% 0.47%
12 2011
0.00%
-9.66% 0.29%
13 2012
13.41%
10.53% 0.12%
14 2013
29.60%
57.58% 0.16%
15 2014 11.39% 21.39% 0.13%
a. Compute the excess returns for the S&P 500 and for FedEx.
b. Graph the excess return of FedEx against those of the S&P 500. Use
Excel to compute the regression line and the $R^2$.
c. Is FedEx stock an aggressive or a defensive stock?
d. Calculate the Sharpe ratio, Jensen's alpha, and Treynor ratio for FedEx.