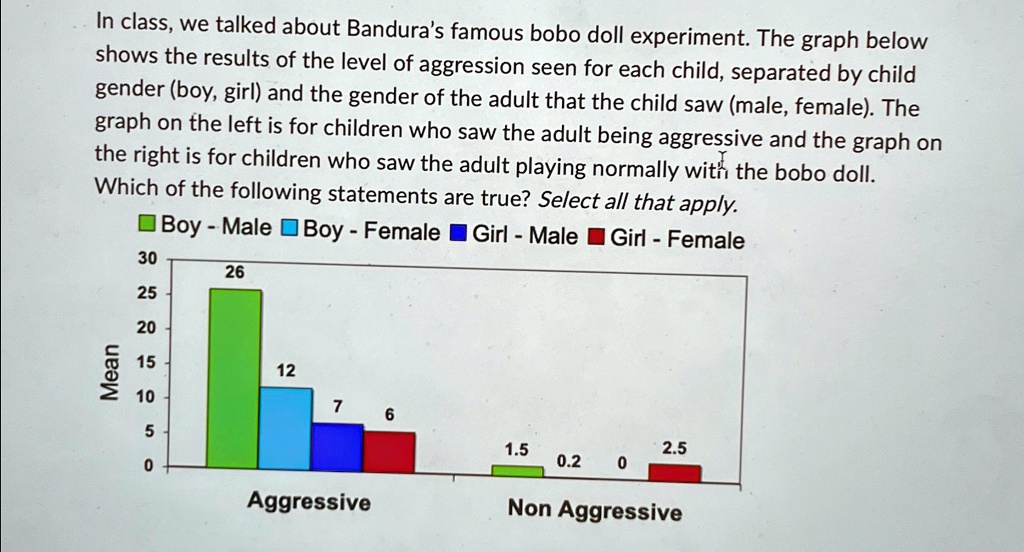
In class, we talked about Bandura's famous Bobo doll experiment. The graph below shows the results of the level of aggression seen for each child, separated by child gender (boy, girl) and the gender of the adult that the child saw (male, female). The graph on the left is for children who saw the adult being aggressive, and the graph on the right is for children who saw the adult playing normally with the Bobo doll.
Which of the following statements are true? Select all that apply. Boy - Male Boy - Female Girl - Male Girl - Female 30 26 25 20 Mean 15 12 10 5 1.5 0.2 2.5 Aggressive Non-Aggressive