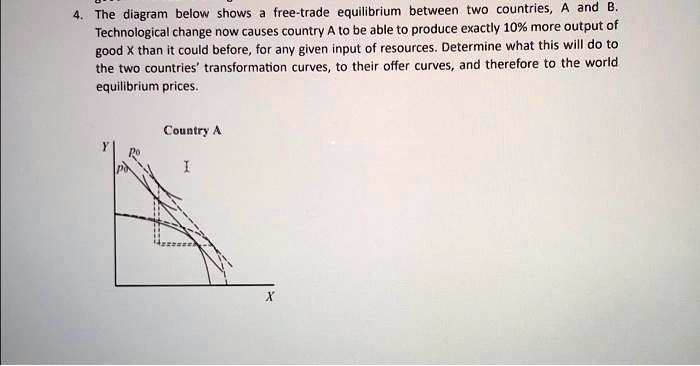
4. The diagram below shows a free-trade equilibrium between two countries, A and B.
Technological change now causes country A to be able to produce exactly 10% more output of
good X than it could before, for any given input of resources. Determine what this will do to
the two countries' transformation curves, to their offer curves, and therefore to the world
equilibrium prices.