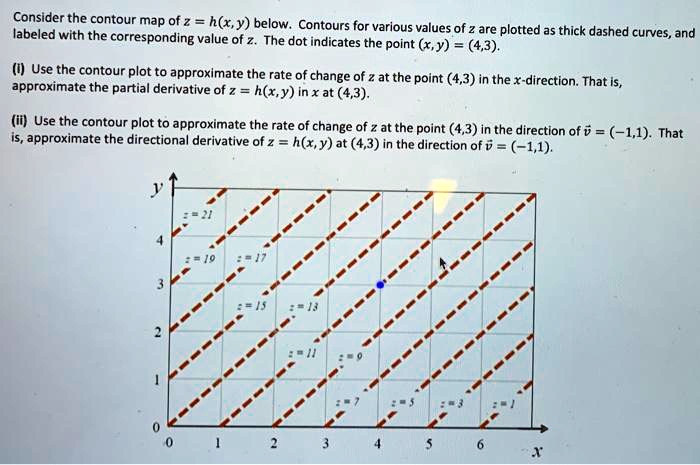
Consider the contour map of z = h(x, y) below. Contours for various values of z are plotted as thick dashed curves, and labeled with the corresponding value of z. The dot indicates the point (x, y) = (4,3).
(i) Use the contour plot to approximate the rate of change of z at the point (4,3) in the x-direction. That is, approximate the partial derivative of z = h(x, y) in x at (4,3).
(ii) Use the contour plot to approximate the rate of change of z at the point (4,3) in the direction of \(\vec{v} = (-1,1)\). That is, approximate the directional derivative of z = h(x, y) at (4,3) in the direction of \(\vec{v} = (-1,1)\).