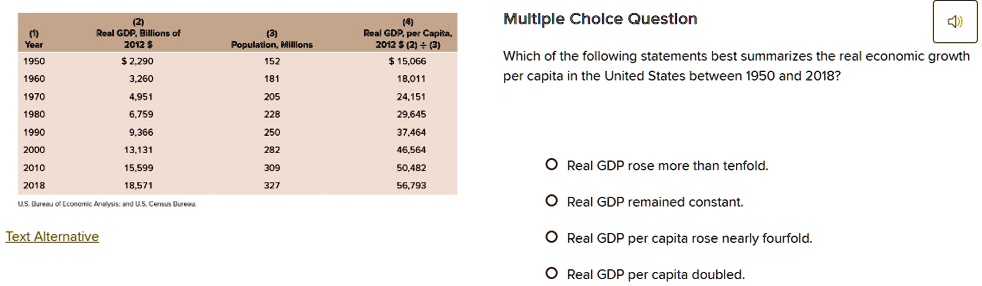
(1)
(2)
Real GDP, Billions of
(4)
Multiple Choice Question
4)
Year
2012 $
(3)
Population, Millions
Real GDP, per Capita,
2012 $ (2) + (3)
1950
$2,290
152
$15,066
Which of the following statements best summarizes the real economic growth
1960
3,260
181
18,011
per capita in the United States between 1950 and 2018?
1970
4,951
205
24,151
1980
6,759
228
29,645
1990
9,366
250
37,464
2000
13,131
282
46.564
2010
15,599
309
50,482
2018
18,571
327
U.S. Bureau of Economic Analysis: and U.S. Census Bureau.
Text Alternative
56,793
O Real GDP rose more than tenfold.
O Real GDP remained constant.
O Real GDP per capita rose nearly fourfold.
O Real GDP per capita doubled.