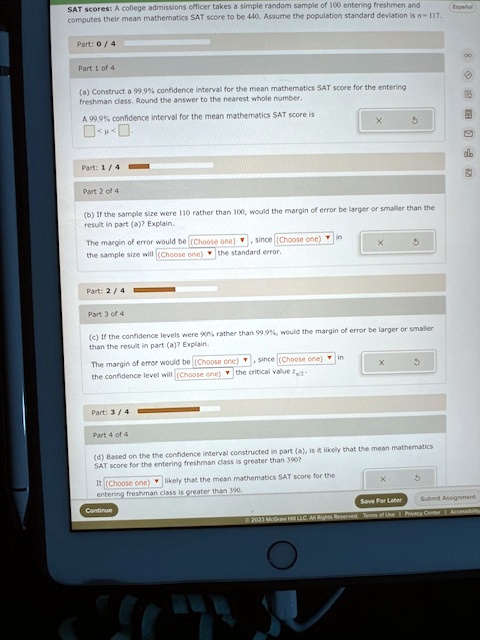
SAT scores: A college admissions officer takes a simple random sample of 100 entering freshmen and computes their mean mathematics SAT score to be 440. Assume the population standard deviation is \(\sigma = 117\).
Part: 0/4
Part 1 of 4
(a) Construct a 99.9% confidence interval for the mean mathematics SAT score for the entering freshman class. Round the answer to the nearest whole number.
A 99.9% confidence interval for the mean mathematics SAT score is
\(\boxed{\quad} < \mu < \boxed{\quad}\)
Part: 1/4
Part 2 of 4
(b) If the sample size were 110 rather than 100, would the margin of error be larger or smaller than the result in part (a)? Explain.
The margin of error would be \((Choose\ \ \boxed{one})\), since \((Choose\ \ \boxed{one})\) in the sample size will \((Choose\ \ \boxed{one})\) the standard error.
Part: 2/4
Part 3 of 4
(c) If the confidence levels were 90% rather than 99.9%, would the margin of error be larger or smaller than the result in part (a)? Explain.
The margin of error would be \((Choose\ \ \boxed{one})\), since \((Choose\ \ \boxed{one})\) in the confidence level will \((Choose\ \ \boxed{one})\) the critical value \(z_{\alpha/2}\).
Part: 3/4
Part 4 of 4
(d) Based on the the confidence interval constructed in part (a), is it likely that the mean mathematics SAT score for the entering freshman class is greater than 390?
It \((Choose\ \ \boxed{one})\) likely that the mean mathematics SAT score for the entering freshman class is greater than 390.