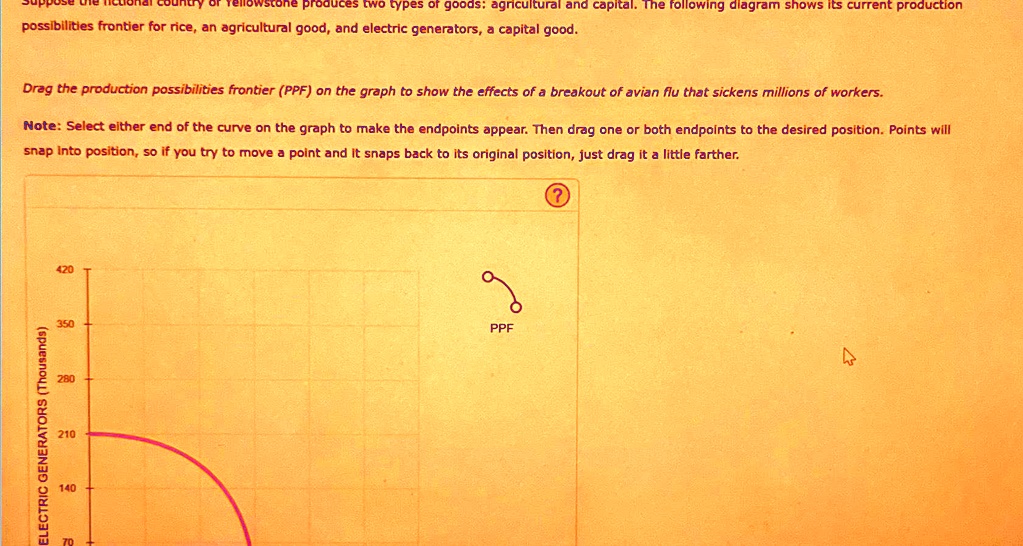
Suppose the fictional country of Yellowstone produces two types of goods: agricultural and capital. The following diagram shows its current production possibilities frontier for rice, an agricultural good, and electric generators, a capital good.
Drag the production possibilities frontier (PPF) on the graph to show the effects of a breakout of avian flu that sickens millions of workers.
Note: Select either end of the curve on the graph to make the endpoints appear. Then drag one or both endpoints to the desired position. Points will snap into position, so if you try to move a point and it snaps back to its original position, just drag it a little farther.
420
ELECTRIC GENERATORS (Thousands)
350
280
210
140
70
PPF