Exercise 1
For public health reasons, we are interested in the concentration of ozone ($O_3$) in the air (in micrograms per milliliter, mg/ml). In particular, we are trying to find out if it is possible to explain the daily maximum ozone rate by the temperature at noon. Ten daily records of maximum ozone rates and the associated temperatures at noon are given in Table 1 below.
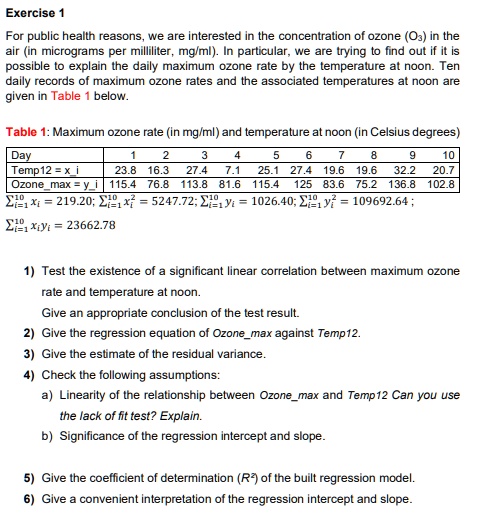
Table 1: Maximum ozone rate (in mg/ml) and temperature at noon (in Celsius degrees)
Day | 1 | 2 | 3 | 4 | 5 | 6 | 7 | 8 | 9 | 10
Temp12 = x_i | 23.8 | 16.3 | 27.4 | 7.1 | 25.1 | 27.4 | 19.6 | 19.6 | 32.2 | 20.7
Ozone_max = y_i | 115.4 | 76.8 | 113.8 | 81.6 | 115.4 | 125 | 83.6 | 75.2 | 136.8 | 102.8
$\sum_{i=1}^{10} x_i = 219.20$; $\sum_{i=1}^{10} x_i^2 = 5247.72$; $\sum_{i=1}^{10} y_i = 1026.40$; $\sum_{i=1}^{10} y_i^2 = 109692.64$;
$\sum_{i=1}^{10} x_i y_i = 23662.78$
1) Test the existence of a significant linear correlation between maximum ozone rate and temperature at noon.
Give an appropriate conclusion of the test result.
2) Give the regression equation of Ozone_max against Temp12.
3) Give the estimate of the residual variance.
4) Check the following assumptions:
a) Linearity of the relationship between Ozone_max and Temp12 Can you use the lack of fit test? Explain.
b) Significance of the regression intercept and slope.
5) Give the coefficient of determination ($R^2$) of the built regression model.
6) Give a convenient interpretation of the regression intercept and slope.