I am having difficulty understanding how to read this chart, and particularly understand the definition behind the data values on the top (measurement bar) and the data that is separated on the top portion of the negative linear association. I don't know how this proves.
Eating problems were not significantly correlated with performance or financial stress.
Well-being was not correlated to substance abuse in men.
Eating problems, substance abuse problems, performance stress, and financial stress were not correlated with a history of help seeking.
Anxiety, depression, intrapersonal stress, and interpersonal stress are correlated with help seeking.
Can somebody please explain? (In easy terms please)
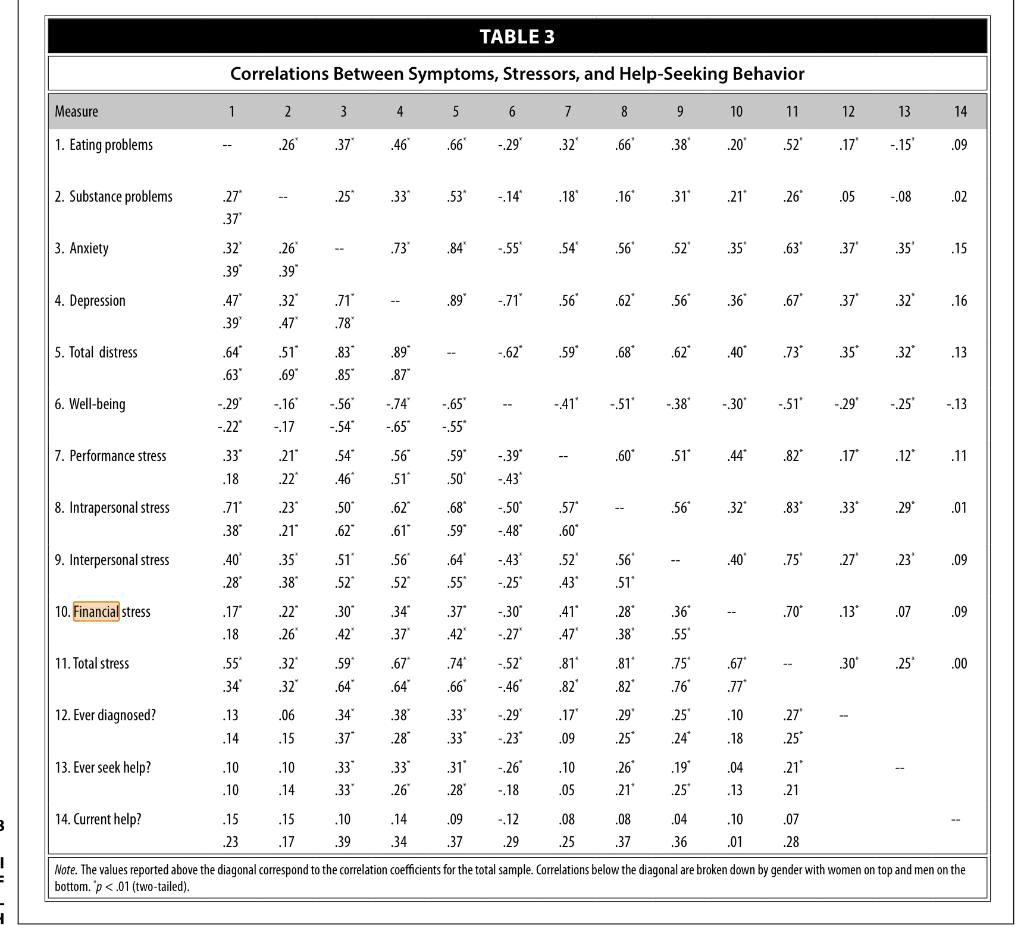
TABLE 3
Correlations Between Symptoms, Stressors, and Help-Seeking Behavior
Measure
1
2
3
4
.46*
5
.66*
6
-.29
8
9
10
.20
11
.52
12
13
.17'
.15'
14
1. Eating problems
.26
.37
.32*
.66
.09
2. Substance problems
.27
.37
.32
.39*
.47
.39
.64
.63*
.29
.22
.33
.18
.71"
.38
.40'
.28
.17
.18
.55
.34
.13
.14
.10
.10
.15
.23
.25
.33*
.53*
-.14'
.18
.16'
.31
.21*
.26
.05
.80'
.02
3. Anxiety
.26
-
.73"
.39
.32
.71"
-
.47
.78
.51
.89*
.69
.85
.18
-.16'
-.56*
-.74"
-.17
-.54
.65
.21"
.54*
.56
.22
.46*
.51
.23
.50
.62
.21
.62
.61*
.35
.51
.56
.38
.52
.52
.22
.30
.34
.26
.42
.37'
.32
.59
.67
.32
.64"
.64
.06
.88
.15
.37
.28
.10
.33
.33
-.14
.33'
.26
.15
.10
.14
.17
.39
.34
.84*
.55*
.54*
.56
.52'
.35
.63*
.37
.35
.15
4. Depression
.89*
-.71'
.56
.62
.56
.36*
.67
.37'
.32
.16
5. Total distress
-.62*
.59*
.68
.62
.40*
.73*
.35*
.32
.13
6. Well-being
-.65
-
-.55
.59
-.39*
.50
-.43"
.68
-.50"
.59*
-.48
.64
-.43*
.55
.25
.37
-.30
.42
-.27'
-.52'
.66
-.46
-.29*
.33
-.23'
.31
.26
.28
-.18
.09
-.12
.37
.29
-.41
-.51*
-.38*
.30
-.51'
.29
-.25
-.13
7. Performance stress
-
.60*
.51
.44*
.82*
.17*
.12*
.11
8. Intrapersonal stress
.57
.60*
.52
.43*
.41
.47*
.81*
.82*
.17*
.09
.10
.05
.80
.25
-
.56
.32
.83*
.33*
.29*
.01
9. Interpersonal stress
.56
.51
.28
.38
.81*
.82*
.29
.25
.26*
.21
.08
.37
.40
.75
.27'
.23
.09
10. Financial stress
.36*
-
.55
.75'
.67*
.76*
.77*
.25
.10
.24
.18
.19
.04
.25
.13
.10
.36
.01
.70*
.13*
.07
.09
11. Total stress
-
.30
.25
.00
12. Ever diagnosed?
.27*
.25
.21*
.21
-
13. Ever seek help?
-
14. Current help?
.28
Note. The values reported above the diagonal correspond to the correlation coefficients for the total sample. Correlations below the diagonal are broken down by gender with women on top and men on the bottom. p < .01 (two-tailed).