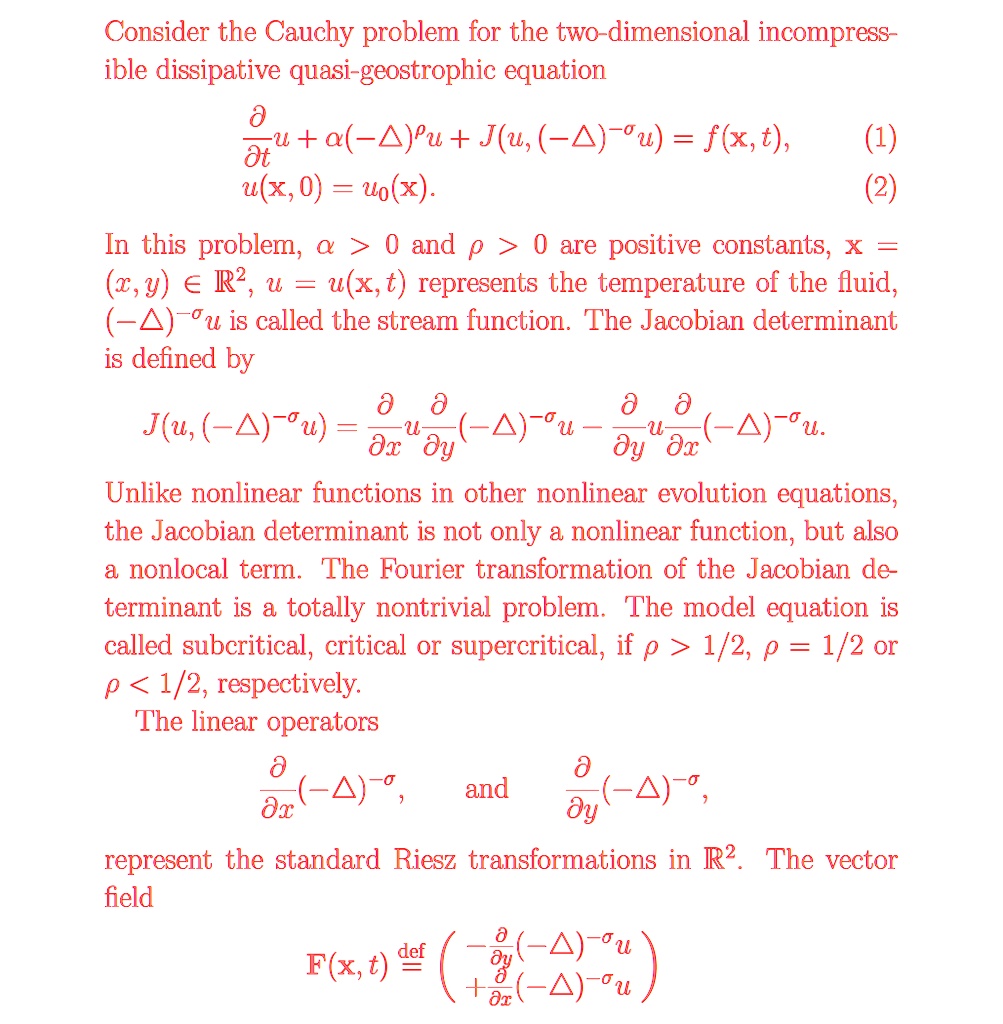
How to visualize this model, Can you do it in Matlab or any program that help me understand the idea in General by Diagram Consider the Cauchy problem for the two-dimensional incompressible dissipative quasi-geostrophic equation
∂u/∂t + α(∇⊥)^ρu + J(u,∇⊥)^(-σ)u = f(x,t),
u(x,0) = u₀(x).
In this problem, α > 0 and ρ > 0 are positive constants, x = (x,y) in R^2, u = u(x,t) represents the temperature of the fluid, ∇⊥^(-σ)u is called the stream function. The Jacobian determinant is defined by
J(u,∇⊥^(-σ)u) = ∂u/∂x ∂(∇⊥)^(-σ)u/∂y - ∂u/∂y ∂(∇⊥)^(-σ)u/∂x.
Unlike nonlinear functions in other nonlinear evolution equations, the Jacobian determinant is not only a nonlinear function, but also a nonlocal term. The Fourier transformation of the Jacobian determinant is a totally nontrivial problem. The model equation is called subcritical, critical or supercritical, if ρ > 1/2, ρ = 1/2 or ρ < 1/2, respectively.
The linear operators
∂(∇⊥)^(-σ)/∂x, and ∂(∇⊥)^(-σ)/∂y,
represent the standard Riesz transformations in R^2. The vector field
F(x,t) = [-(∂u/∂y)(∇⊥)^(-σ)u, +(∂u/∂x)(∇⊥)^(-σ)u]