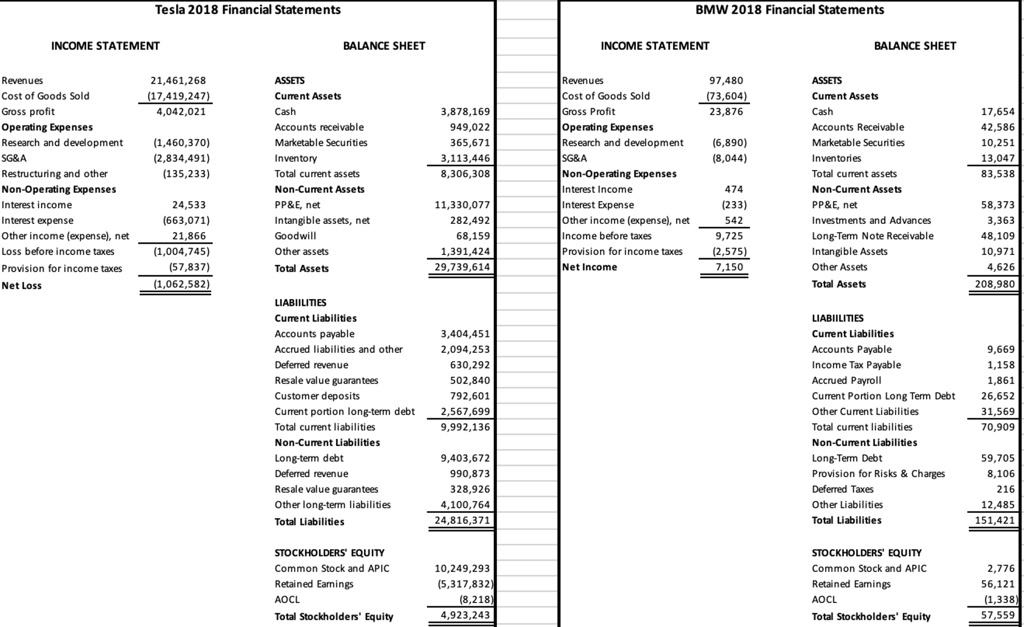
Use the Tesla and BMW financial statements provided to the right to calculate and analyze:
Part 1. Calculate the quick ratio and interest coverage ratio for each company.
Be very careful about the sign of interest expense! As a hint, Tesla's interest coverage ratio is NEGATIVE.
In 2-3 sentences total, comment on whether there is a difference between the two companies in terms of financial health based on these two credit ratios.
Tesla 2018 Financial Statements
BMW 2018 Financial Statements
INCOME STATEMENT
BALANCE SHEET
INCOME STATEMENT
BALANCE SHEET
Revenues 21,461,268 Cost of Goods Sold (17,419,247) Gross profit 4,042,021 Operating Expenses Research and development (1,460,370) SG&A (2,834,491) Restructuring and other (135,233) Non-Operating Expenses Interest income 24,533 Interest expense (663,071) Other income (expense), net 21,866 Loss before income taxes (1,004,745) Provision for income taxes (57,837) Net Loss (1,062,582)
ASSETS Current Assets Cash Accounts receivable Marketable Securities Inventory Total current assets Non-Current Assets PP&E, net Intangible assets, net Goodwill Other assets Total Assets
Revenues 97,480 Cost of Goods Sold (73,604) Gross Profit 23,876 Operating Expenses Research and development (6,890) SG&A (8,044) Non-Operating Expenses Interest Income 474 Interest Expense (233) Other income (expense), net 542 Income before taxes 9,725 Provision for income taxes (2,575) Net Income 7,150
ASSETS Current Assets Cash Accounts Receivable Marketable Securities Inventories Total current assets Non-Current Assets PP&E,net Investments and Advances Long-Term Note Receivable Intangible Assets Other Assets Total Assets
3,878,169 949,022 365,671 3,113,446 8,306,308
17,654 42,586 10,251 13,047 83,538
11,330,077 282,492 68,159 1,391,424 29,739,614
58,373 3,363 48,109 10,971 4,626 208,980
LIABILITIES Current Liabilities Accounts payable Accrued liabilities and other Deferred revenue Resale value guarantees Customer deposits Current portion long-term debt Total current liabilities Non-Current Liabilities Long-term debt Deferred revenue Resale value guarantees Other long-term liabilities Total Liabilities
LIABILITIES Current Liabilities Accounts Payable 9,669 Income Tax Payable 1,158 Accrued Payroll 1,861 Current Portion Long Term Debt 26,652 Other Current Liabilities 31,569 Total current liabilities 70,909 Non-Current Liabilities Long-Term Debt 59,705 Provision for Risks & Charges 8,106 Deferred Taxes 216 Other Liabilities 12,485 Total Liabilities 151,421
3,404,451 2,094,253 630,292 502,840 792,601 2,567,699 9,992,136
9,403,672 990,873 328,926 4,100,764 24,816,371
STOCKHOLDERS' EQUITY Common Stock and APIC Retained Earnings AOCL Total Stockholders Equity
STOCKHOLDERS' EQUITY Common Stock and APIC Retained Earnings AOCL Total Stockholders Equity
10,249,293 (5,317,832) (8,218) 4,923,243
2,776 56,121 1,338 57,559