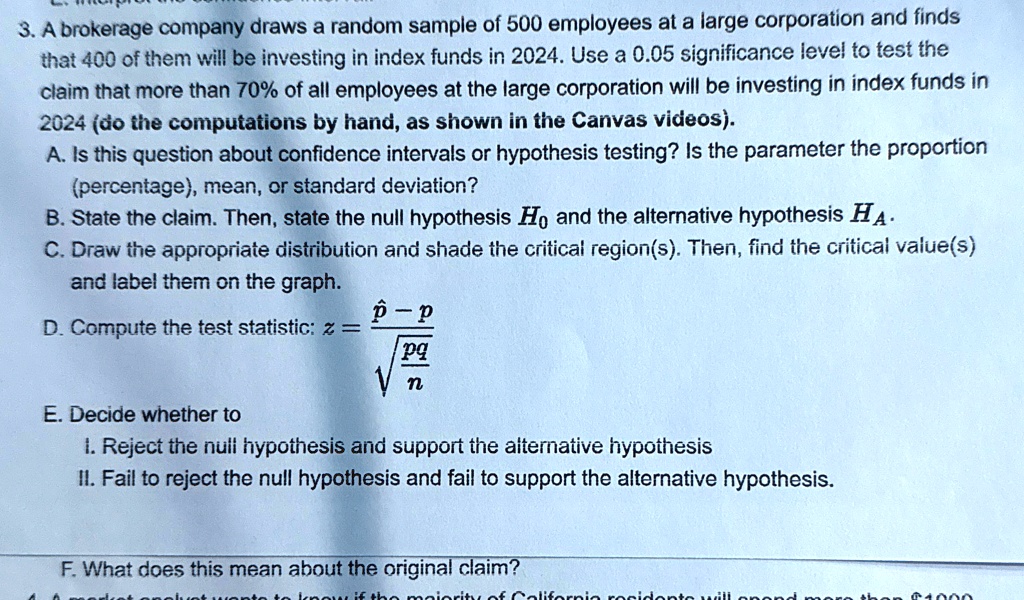
3. A brokerage company draws a random sample of 500 employees at a large corporation and finds that 400 of them will be investing in index funds in 2024. Use a 0.05 significance level to test the claim that more than 70% of all employees at the large corporation will be investing in index funds in 2024 (do the computations by hand, as shown in the Canvas videos).
A. Is this question about confidence intervals or hypothesis testing? Is the parameter the proportion (percentage), mean, or standard deviation?
B. State the claim. Then, state the null hypothesis $H_0$ and the alternative hypothesis $H_A$.
C. Draw the appropriate distribution and shade the critical region(s). Then, find the critical value(s) and label them on the graph.
D. Compute the test statistic: $z = \frac{\hat{p} - p}{\sqrt{\frac{pq}{n}}}$
E. Decide whether to
I. Reject the null hypothesis and support the alternative hypothesis
II. Fail to reject the null hypothesis and fail to support the alternative hypothesis.
F. What does this mean about the original claim?