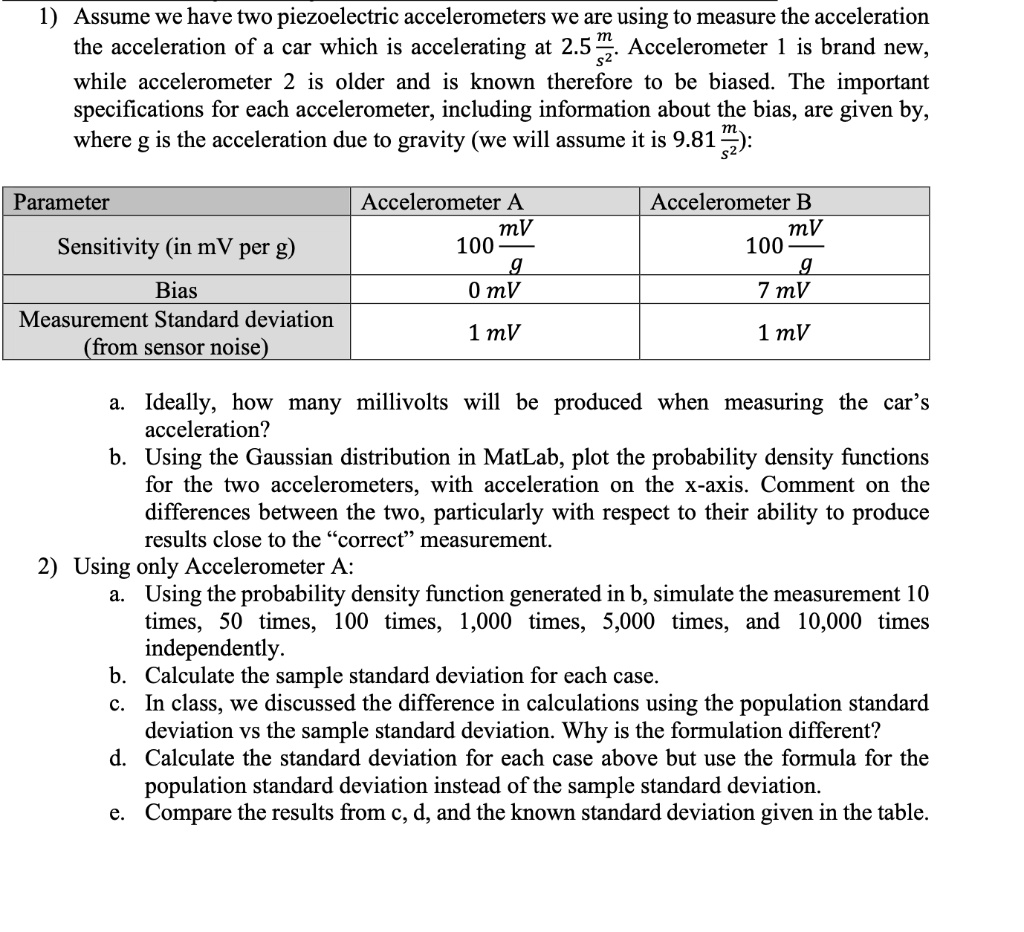
m\n1) Assume we have two piezoelectric accelerometers we are using to measure the acceleration\nthe acceleration of a car which is accelerating at 2.5\frac{m}{s^2}. Accelerometer 1 is brand new,\nwhile accelerometer 2 is older and is known therefore to be biased. The important\nspecifications for each accelerometer, including information about the bias, are given by,\nwhere g is the acceleration due to gravity (we will assume it is 9.81\frac{m}{s^2}):\n\nParameter\nSensitivity (in mV per g)\nBias\nMeasurement Standard deviation\n(from sensor noise)\nAccelerometer A\n\frac{100 mV}{g}\n0 mV\n1 mV\nAccelerometer B\n\frac{100 mV}{g}\n7 mV\n1 mV\na. Ideally, how many millivolts will be produced when measuring the car's\nacceleration?\nb. Using the Gaussian distribution in MatLab, plot the probability density functions\nfor the two accelerometers, with acceleration on the x-axis. Comment on the\ndifferences between the two, particularly with respect to their ability to produce\nresults close to the \"correct\" measurement.\n2) Using only Accelerometer A:\na. Using the probability density function generated in b, simulate the measurement 10\ntimes, 50 times, 100 times, 1,000 times, 5,000 times, and 10,000 times\nindependently.\nb. Calculate the sample standard deviation for each case.\nc. In class, we discussed the difference in calculations using the population standard\ndeviation vs the sample standard deviation. Why is the formulation different?\nd. Calculate the standard deviation for each case above but use the formula for the\npopulation standard deviation instead of the sample standard deviation.\ne. Compare the results from c, d, and the known standard deviation given in the table.