4.
Section 6.4 Applied Optimization
ITEMS
OPEN
INFO
CONCEPT REVIEW
< Previous
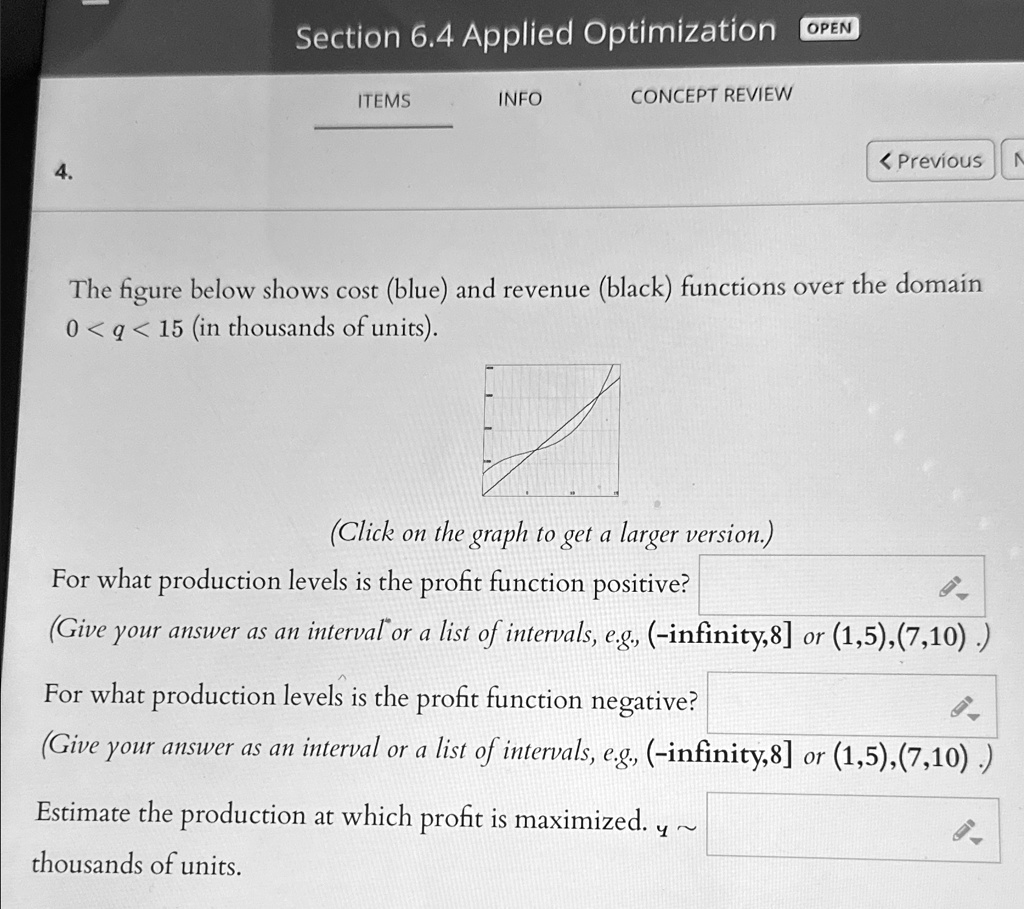
The figure below shows cost (blue) and revenue (black) functions over the domain
$0 < q < 15$ (in thousands of units).
(Click on the graph to get a larger version.)
For what production levels is the profit function positive?
(Give your answer as an interval or a list of intervals, e.g., $(\text{-infinity},8]$ or $(1,5),(7,10)$ .)
For what production levels is the profit function negative?
(Give your answer as an interval or a list of intervals, e.g., $(\text{-infinity},8]$ or $(1,5),(7,10)$.)
Estimate the production at which profit is maximized. ~$ \approx$
thousands of units.