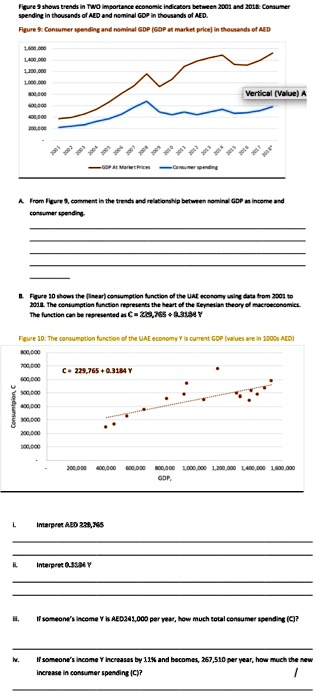
Figure 9 shows trends in TWO importance economic indicators between 2001 and 2018: Consumer
spending in thousands of AED and nominal GDP in thousands of AED.
Figure 9: Consumer spending and nominal GDP (GDP at market price) in thousands of AED
1,600,000
1,400,000
1,200,000
1,000,000
800,000
600,000
400,000
200,000
GDP At Market Prices
Consumer spending
Vertical (Value) A
A. From Figure 9, comment in the trends and relationship between nominal GDP as income and
consumer spending.
B. Figure 10 shows the (linear) consumption function of the UAE economy using data from 2001 to
2018. The consumption function represents the heart of the Keynesian theory of macroeconomics.
The function can be represented as $C = 229,765 + 0.3184 Y$
Figure 10: The consumption function of the UAE economy Y is current GDP (values are in 1000s AED)
800,000
700,000
600,000
500,000
400,000
300,000
200,000
100,000
$C = 229,765 + 0.3184 Y$
200,000 400,000 600,000 800,000 1,000,000 1,200,000 1,400,000 1,500,000
GDP,
L. Interpret AED 228,765
II. Interpret 0.3184 Y
III. If someone's income Y is AED341,000 per year, how much total consumer spending (C)?
IV. If someone's income Y increases by 11% and becomes, 367,510 per year, how much the new
increase in consumer spending (C)?