(a) Let xi, i = 1,2, ...,n be a sample. Define Yi = axi + b for some constants a and b. What is therelationship between the means ~ and y? What is the relationship between the standard deviations S and Sy? Feel free to use the results from class, but show all work!(b) A sample of temperatures has a mean of 92.1deg F with a standard deviation of 3.4deg F. Use the result from part (a) and the relationship F = 1.8C + 32 between degrees Fahrenheit and degrees Celcius to find the mean and standard devation of the sample in degrees Celcius.I have also included some slides from class for (a) otherwise just do without those
Mean
Mean
Example: The weights (in pounds) of six horses are measured by a
The sample mean of n observations 1, 2,...,, is
veterinarian.
Horse 1 2 3 4 6 Weight 600 627 645 679 693 671
n
n
There are n=6 horses.The observations are =600,x=627 X3=645,x4=679,x5=693,and6=671.
Note that the mean of two numbers is the number right in the middle of them. In general, you can think of the mean as the "balancing point" of the data.
The mean weight of the six horses is
=652.5~653 Ibs
6
Note that the mean has the same units as the observations. All of the observations must be in the same units in order for the mean to make sense!
Mean
The mean is a "measure of central tendency." It is supposed to represent the "average" observation, the value that most closely aligns with most of the observed values.
Mean
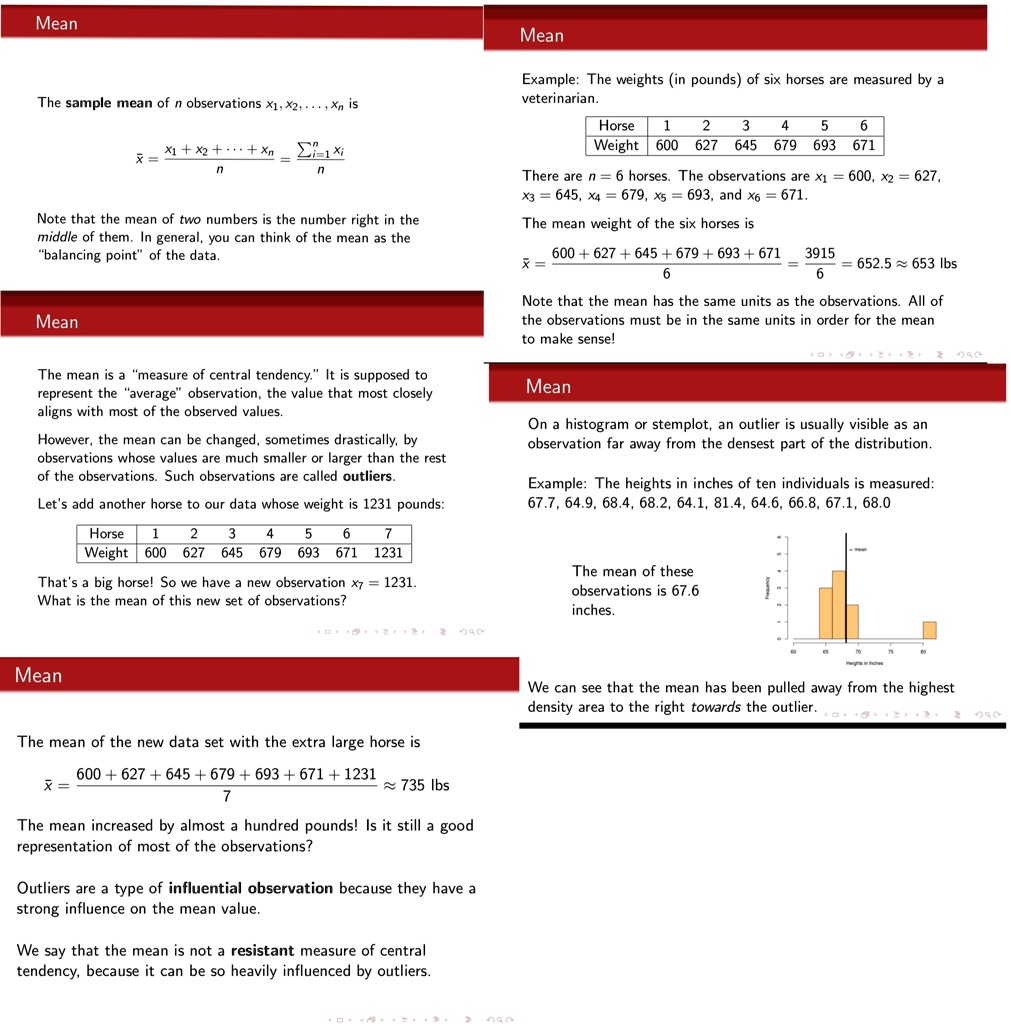
On a histogram or stemplot, an outlier is usually visible as an observation far away from the densest part of the distribution.
However, the mean can be changed, sometimes drastically, by observations whose values are much smaller or larger than the rest of the observations. Such observations are called outliers.
Example: The heights in inches of ten individuals is measured 67.7, 64.9, 68.4, 68.2, 64.1, 81.4, 64.6, 66.8, 67.1, 68.0
Let's add another horse to our data whose weight is 1231 pounds
Horse 1 2 3 4 5 6 7 Weight 600 627 645 679 693 671 1231
The mean of these observations is 67.6 inches.
That's a big horse! So we have a new observation x7 = 1231 What is the mean of this new set of observations?
Mean
We can see that the mean has been pulled away from the highest density area to the right towards the outlier.
The mean of the new data set with the extra large horse is
600+627+645+679+693+671+1231 ~735 Ibs 7
The mean increased by almost a hundred pounds! Is it still a good representation of most of the observations?
Outliers are a type of influential observation because they have a strong influence on the mean value
We say that the mean is not a resistant measure of central tendency, because it can be so heavily influenced by outliers