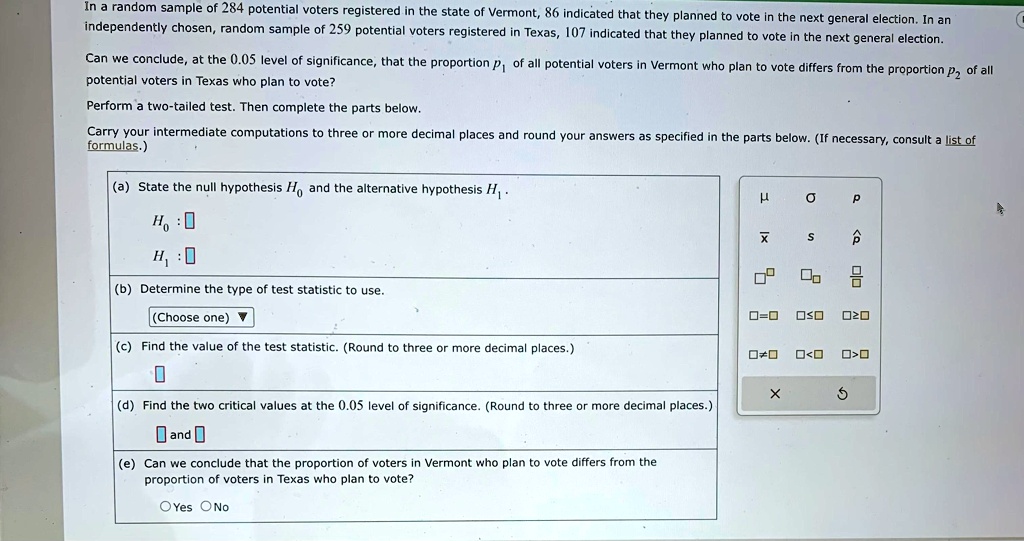
In a random sample of 284 potential voters registered in the state of Vermont, 86 indicated that they planned to vote in the next general election. In an
independently chosen, random sample of 259 potential voters registered in Texas, 107 indicated that they planned to vote in the next general election.
Can we conclude, at the 0.05 level of significance, that the proportion $p_1$ of all potential voters in Vermont who plan to vote differs from the proportion $p_2$ of all
potential voters in Texas who plan to vote?
Perform a two-tailed test. Then complete the parts below.
Carry your intermediate computations to three or more decimal places and round your answers as specified in the parts below. (If necessary, consult a list of
formulas.)
(a) State the null hypothesis $H_0$ and the alternative hypothesis $H_1$.
$H_0$:
$H_1$:
(b) Determine the type of test statistic to use.
(Choose one)
(c) Find the value of the test statistic. (Round to three or more decimal places.)
(d) Find the two critical values at the 0.05 level of significance. (Round to three or more decimal places.)
and
(e) Can we conclude that the proportion of voters in Vermont who plan to vote differs from the
proportion of voters in Texas who plan to vote?
Yes No