2
Depth (feet) ?
10
12
3
22
24 24
20
22
Temperature
108 65
JAN FEB MAR APR MAY JUN JUL AUG SEP OCT NOV DEC
1968
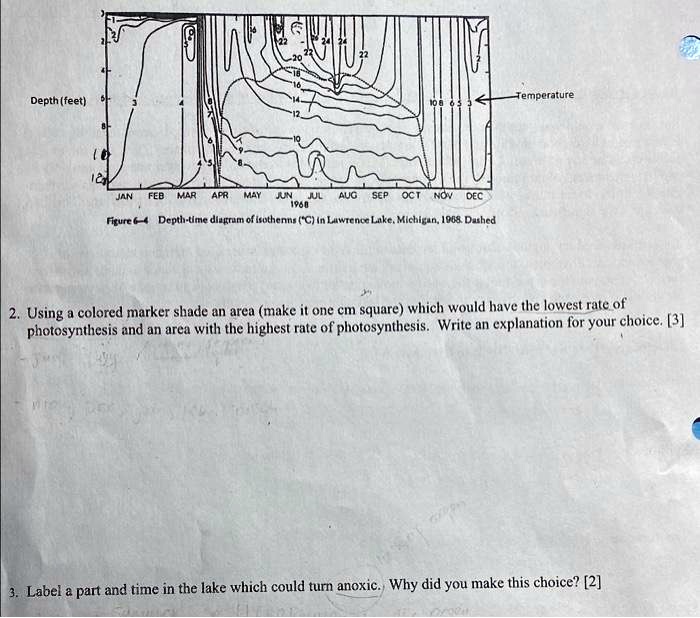
Figure 6-4 Depth-time diagram of isotherms (°C) in Lawrence Lake, Michigan, 1968. Dashed
2. Using a colored marker shade an area (make it one cm square) which would have the lowest rate of
photosynthesis and an area with the highest rate of photosynthesis. Write an explanation for your choice. [3]
3. Label a part and time in the lake which could turn anoxic. Why did you make this choice? [2]