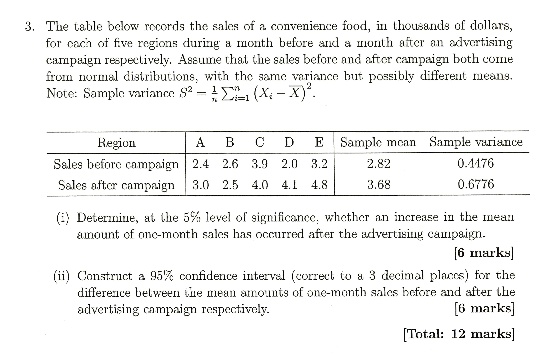
3. The table below records the sales of a convenience food, in thousands of dollars for each of five regions during a month before and a month after an advertising campaign respectively. Assume that the sales before and after campaign both come from normal distributions, with the same variance but possibly different means. Note: Sample variance s^2 = 1/n * Σ(Xi - X̄)^2.
Region A D E Sample mean Sample variance Sales before campaign 2.4 2.6 3.9 2.0 3.2 2.82 0.4476 Sales after campaign 3.0 2.5 4.0 4.1 4.8 3.68 0.6776
(i) Determine, at the 5% level of significance, whether an increase in the mean amount of one-month sales has occurred after the advertising campaign. [6 marks]
(ii) Construct a 95% confidence interval (correct to 3 decimal places) for the difference between the mean amounts of one-month sales before and after the advertising campaign respectively. [6 marks] [Total: 12 marks]