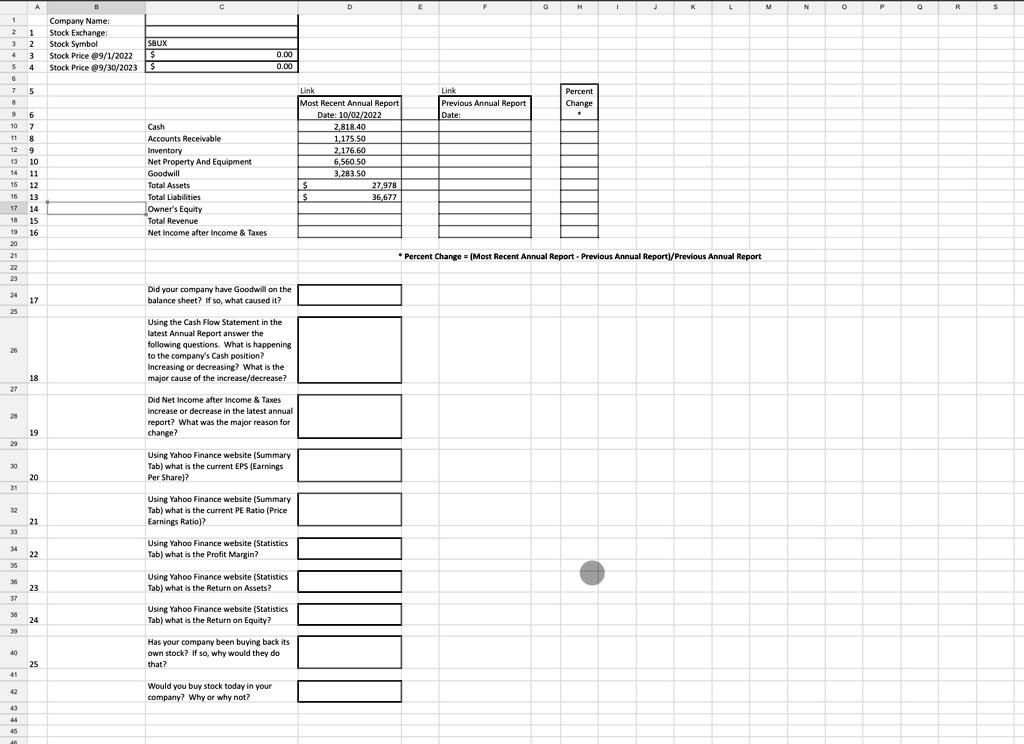
analyize the financial performance Starbucks over the last 13 months. The focus will be on the latest annual report filed with the SEC and the previous annual report. Use the SEC search engine called EDGAR to gather the information from the annual reports. Also use Yahoo Finance to discover certain financial performance measurements related to Starbucks.
D
K
M
a
R
Company Name: Stock Exchange: 2 Stock Symbol 3 Stock Price @9/1/2022 Stock Price @9/30/2023
0.00 0.00
7
Link Most Recent Annual Report Date: 10/02/2022 2,818.40 1,175.50 2,176.60 6,560.50 3,283.50 27.978 36,677
Link Previous Annual Report Date:
Percent Change
9 6 10 7 1 8 12 9 10 14 11 12 16 13 17 14 16 15 16
Cash Accounts Receivable Inventory Net Property And Equipment Goodwill Total Assets Total Liabilities Owner's Equity Total Revenue Net Income after Income & Taxes
21 22 23 24 17
Percent Change=(Most Recent Annual Report - Previous Annual Report)/Previous Annual Report
Did your company have Goodwill on the balance sheet? If so, what caused it?
Using the Cash Flow Statement in the Iatest Annual Report answer the following questions. What is happening to the company's Cash position? Increasing or decreasing? What is the major cause of the increase/decrease?
26
18 27
Did Net Income after Income & Taxes increase or decrease in the latest annual report? What was the major reason for change?
28
19 29
Using Yahoo Finance website (Summary Tab) what is the current EPS (Earnings Per Share)?
30 20 31
Using Yahoo Finance website (Summary Tab) what is the current PE Ratio (Price Earnings Ratio)?
32
21
33
34 22 35
Using Yahoo Finance website (Statistics Tab) what is the Profit Margin?
36 23 37
Using Yahoo Finance website (Statistics Tab) what is the Return on Assets?
38 24 39
Using Yahoo Finance website (Statistics Tab) what is the Return on Equity?
Has your company been buying back its own stock? If so, why would they do that?
40
25 41
42 43 44 45
Would you buy stock today in your company? Why or why not?