Activity 5 - Complete this exercise on a fifth Excel tab.
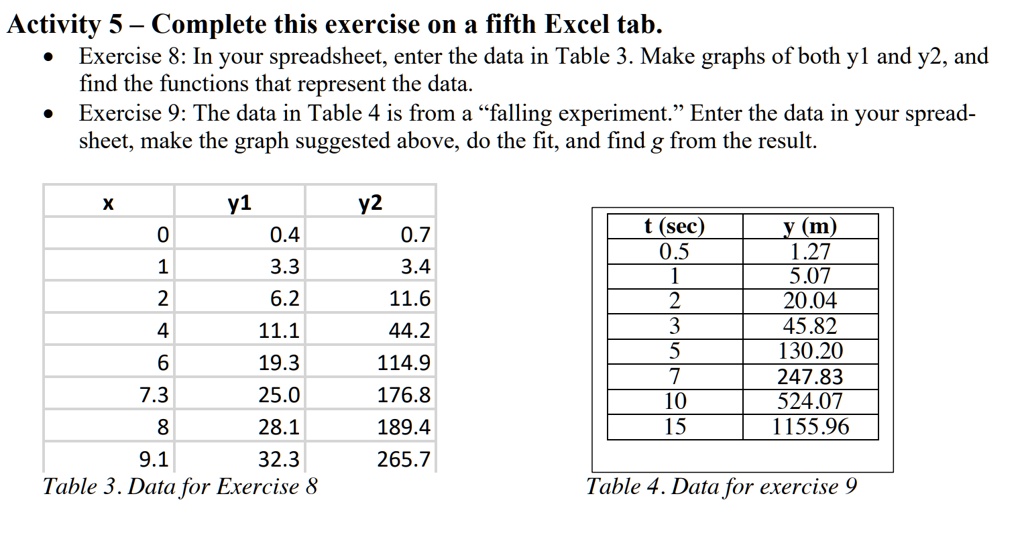
• Exercise 8: In your spreadsheet, enter the data in Table 3. Make graphs of both y1 and y2, and find the functions that represent the data.
• Exercise 9: The data in Table 4 is from a \"falling experiment.\" Enter the data in your spreadsheet, make the graph suggested above, do the fit, and find g from the result.
x
y1
y2
0
0.4
0.7
1
3.3
3.4
2
6.2
11.6
4
11.1
44.2
6
19.3
114.9
7.3
25.0
176.8
8
28.1
189.4
9.1
32.3
265.7
Table 3. Data for Exercise 8
t (sec)
y (m)
0.5
1.27
1
5.07
2
20.04
3
45.82
5
130.20
7
247.83
10
524.07
15
1155.96
Table 4. Data for exercise 9