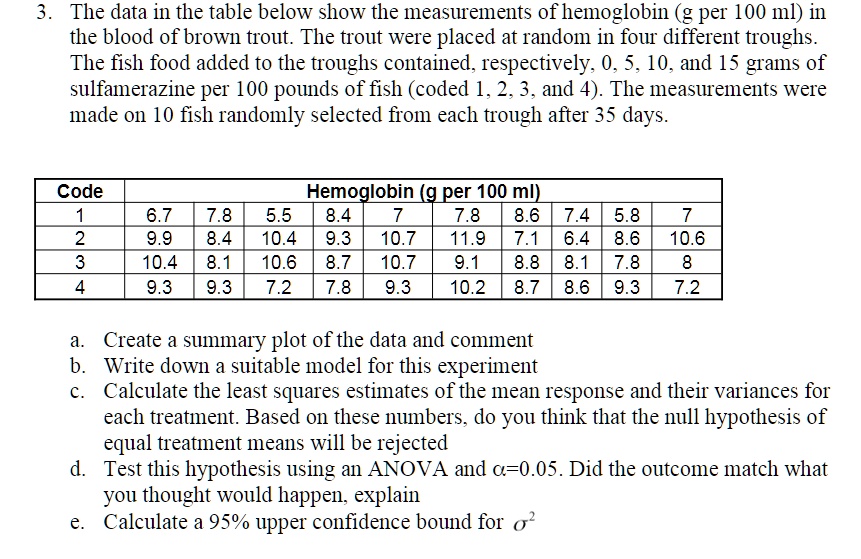
The data in the table below show the measurements of hemoglobin (g per 100 ml) in the blood of brown trout. The trout were placed at random in four different troughs. The fish food added to the troughs contained, respectively, 0, 5, 10, and 15 grams of sulfamerazine per 100 pounds of fish (coded 1, 2, 3, and 4). The measurements were made on 10 fish randomly selected from each trough after 35 days.
Code 1 2 3 4
Hemoglobin (g per 100 ml)
5.5 8.4 7 7.8
8.6 7.4 5.8 10.4
9.3 10.7 11.9 7.1
6.4 8.6 10.6 8.7
10.7 9.1 8.8 8.1
7.8 7.2 7.8 9.3
10.2 8.7 8.6 9.3
6.7 9.9 10.4 9.3
7.8 8.4 8.1 9.3
7 10.6 8 7.2
a. Create a summary plot of the data and comment
b. Write down a suitable model for this experiment
c. Calculate the least squares estimates of the mean response and their variances for each treatment. Based on these numbers, do you think that the null hypothesis of equal treatment means will be rejected
d. Test this hypothesis using an ANOVA and α = 0.05. Did the outcome match what you thought would happen, explain
e. Calculate a 95% upper confidence bound for σ^2