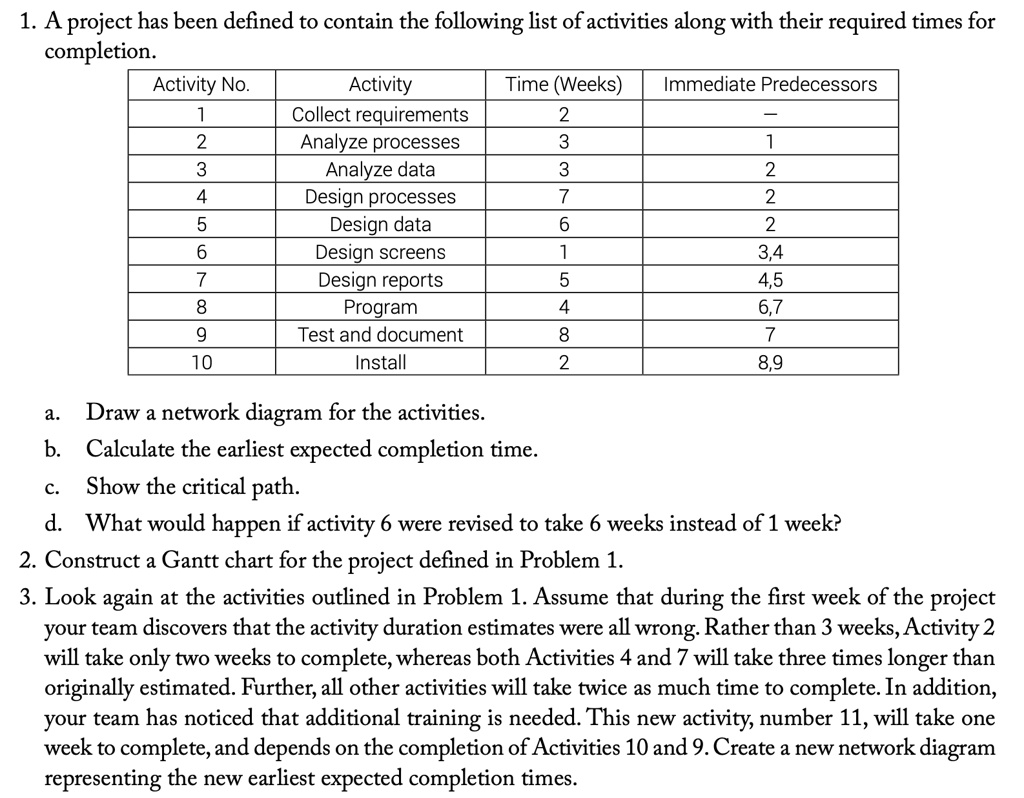
1. A project has been defined to contain the following list of activities along with their required times for
completion.
Activity
Activity No.
Time (Weeks) Immediate Predecessors
1
Collect requirements
2
-
2
Analyze processes
3
1
3
Analyze data
3
2
4
Design processes
7
2
5
Design data
6
2
6
Design screens
1
3,4
7
Design reports
5
4,5
8
Program
4
6,7
9
Test and document
8
7
10
Install
2
8,9
a. Draw a network diagram for the activities.
b. Calculate the earliest expected completion time.
c. Show the critical path.
d. What would happen if activity 6 were revised to take 6 weeks instead of 1 week?
2. Construct a Gantt chart for the project defined in Problem 1.
3. Look again at the activities outlined in Problem 1. Assume that during the first week of the project
your team discovers that the activity duration estimates were all wrong. Rather than 3 weeks, Activity 2
will take only two weeks to complete, whereas both Activities 4 and 7 will take three times longer than
originally estimated. Further, all other activities will take twice as much time to complete. In addition,
your team has noticed that additional training is needed. This new activity, number 11, will take one
week to complete, and depends on the completion of Activities 10 and 9. Create a new network diagram
representing the new earliest expected completion times.