Homework: Chapter 08
PRICE AND COST PER UNIT (Dollars)
70
60
50
40
30
20
10
0
0
5
10
15
20
25
30
35
40
45
50
QUANTITY OF OUTPUT (Thousands of shirts)
ATC
AVC
MC
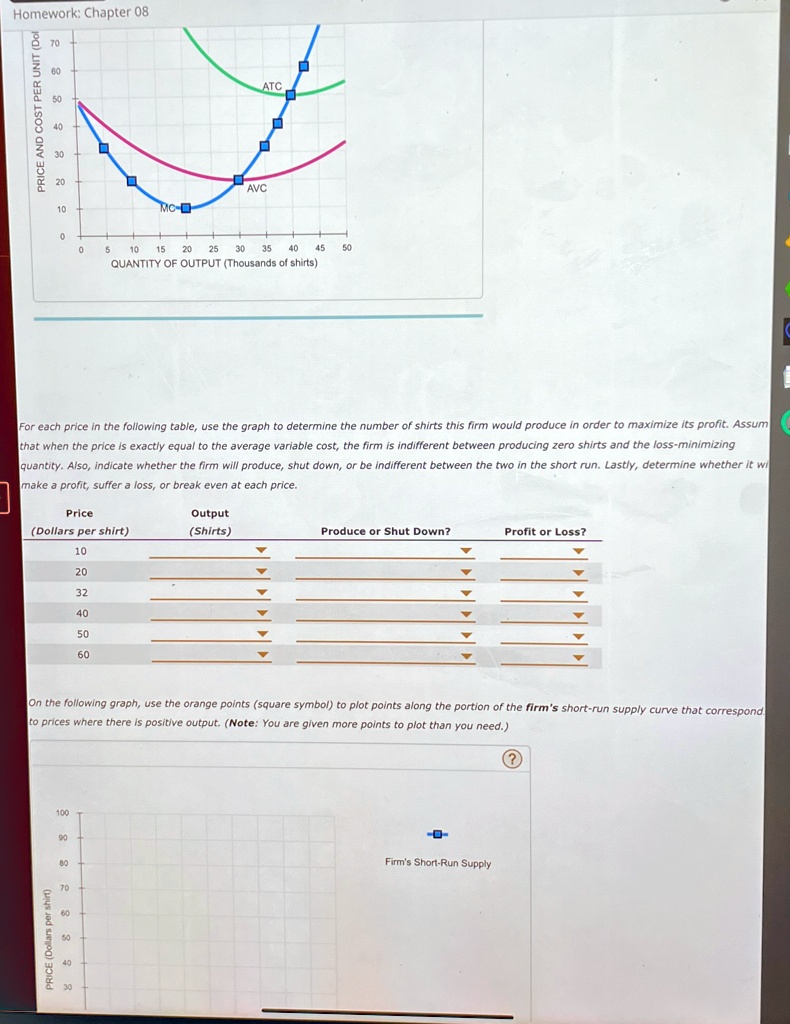
For each price in the following table, use the graph to determine the number of shirts this firm would produce in order to maximize its profit. Assum
that when the price is exactly equal to the average variable cost, the firm is indifferent between producing zero shirts and the loss-minimizing
quantity. Also, indicate whether the firm will produce, shut down, or be indifferent between the two in the short run. Lastly, determine whether it wi
make a profit, suffer a loss, or break even at each price.
Price
(Dollars per shirt)
10
20
32
40
50
60
Output
(Shirts)
Produce or Shut Down?
Profit or Loss?
?
?
?
?
?
?
?
?
?
?
?
?
On the following graph, use the orange points (square symbol) to plot points along the portion of the firm's short-run supply curve that correspond
to prices where there is positive output. (Note: You are given more points to plot than you need.)
100
90
80
70
60
50
40
30
PRICE (Dollars per shirt)
Firm's Short-Run Supply