Fill in the following table:
Interpret R^2 and adjusted R^2.
Interpret the F-statistic.
a. What is the null hypothesis?
b. What is the alternative hypothesis?
c. What is the inference of this test?
Interpret the slope coefficient (b).
to 2.4
Extra credit 2 points
Derive adjusted R^2 from R^2.
Extra credit 2 points
What is the relationship between the t-stat for b and the F-stat? Holds only for simple linear regression.
I need help answering all the questions. Thank you
OLS by Hand
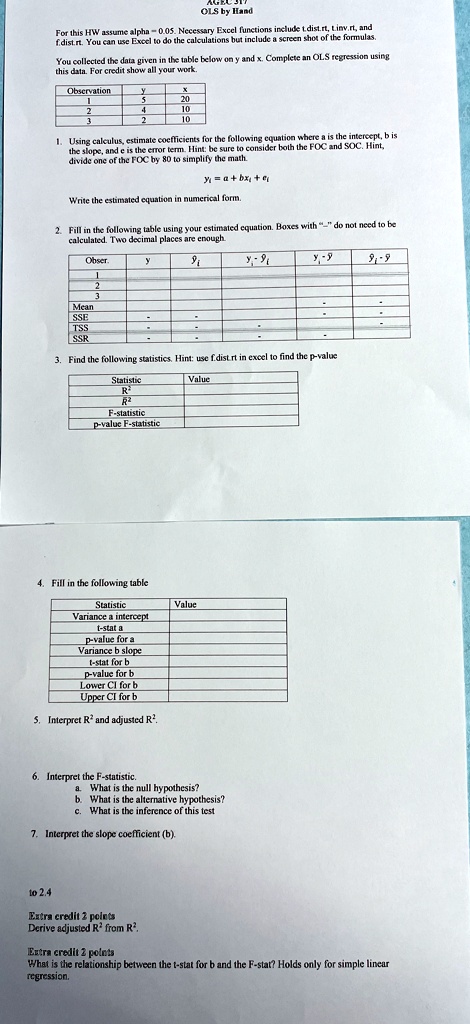
For this HW assume alpha=0.05. Necessary Excel functions include dist.rt, inv.rt, and f dist r. You can use Excel to do the calculations but include a screenshot of the formulas. You collected the data given in the table below on y and x. Complete an OLS regression using this data. For credit, show all your work.
Observation
1. Using calculus, estimate coefficients for the following equation where a is the intercept, b is the slope, and c is the error term. Hint: be sure to consider both the FOC and SOC. Hint: divide one of the FOC by 80 to simplify the math. 1 + xq + = K Write the estimated equation in numerical form.
Fill in the following table using your estimated equation. Boxes with "do not need to be calculated." Two decimal places are enough. Observed y yi y-91 y-y 9;-9
Mean SSE TSS SSR
Find the following statistics. Hint: use f.dist.rt in Excel to find the p-value. Statistic Value R^2 52 F-statistic p-value F-statistic
4. Fill in the following table:
Statistic
Value
Variance a intercept t-stat a p-value for a Variance b slope t-stat for b p-value for b Lower CI for b Upper CI for b
5. Interpret R and adjusted R^2
6. Interpret the F-statistic. What is the null hypothesis? b. What is the alternative hypothesis c. What is the inference of this test
7. Interpret the slope coefficient b
to 2.4
Extra credit 2 points Derive adjusted R from R
Extra credit 2 points What is the relationship between the t-stat for b and the F-stat? Holds only for simple linear regression.