For a hypothesis test of a single population
proportion, we can use the \"Statistics\" tab in the
Probability Calculator in Geogebra or \"Stat > Basic
Statistics > 1 Proportion\" in Minitab.
For Geogebra, click the drop-down menu near the
top (default is \"Z Test of a Mean\\") and choose \"Z
Test of a Proportion.\" Enter the number of
Successes (usually written as $x$, which is not the
same thing as $\bar{x}$), and sample size N. We'll use a
sample of size 16 in which there are 5 successes.
For Minitab, first select \"Summarized Data\" from
the drop-down menu, then enter the number of
events (Successes, $x$), and numer of trials (sample
size N). Check \"Perform Hypothesis Test\" and
enter the hypothesized proportion. Click Options
and select your alternate hypothesis and \"Normal
Approximation\" from the drop-down list.
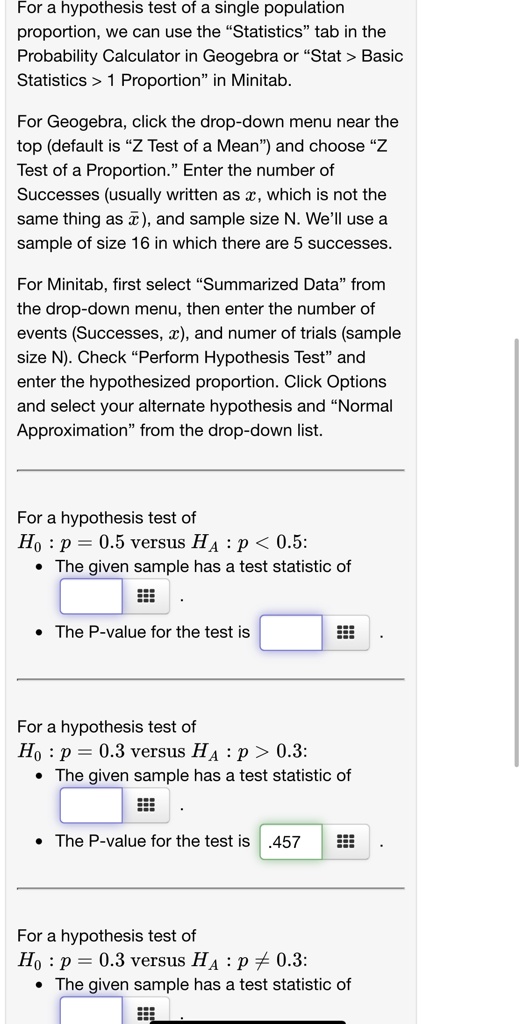
For a hypothesis test of
$H_0: p = 0.5$ versus $H_A: p < 0.5$:
• The given sample has a test statistic of
The P-value for the test is
For a hypothesis test of
$H_0: p = 0.3$ versus $H_A: p > 0.3$:
• The given sample has a test statistic of
The P-value for the test is .457
For a hypothesis test of
$H_0: p = 0.3$ versus $H_A: p \neq 0.3$:
The given sample has a test statistic of