Ace - AI Tutor
Ask Our Educators
Textbooks
My Library
Flashcards
Scribe - AI Notes
Notes & Exams
Download App
ssssss cmd

ssssss c.

Divider

Questions asked

AWAITING AN EDUCATOR

1. Use the 2015 tax table to find the income tax for a taxpayer with taxable income of $48,450 filing as head of household.

View Answer
divider
INSTANT ANSWER

When filing taxes, it is possible to deduct out-of-pocket medical expenses if or when such expenses exceed 7.5% of adjusted gross income (AGI). Suppose Luke’s Adjusted Gross Income was $35,000. Luke had a shoulder surgery this year which cost $20,000. His health insurance deductible was $4,000, so Luke needed to pay $4,000 out of pocket, and then his insurance covered the remaining cost of the surgery. a) How much is 7.5% of Luke’s AGI? b) How much of what Luke paid towards his surgery exceeded 7.5% of his AGI? c) Luke is able to deduct the value from b) from his taxes this year. Assume Luke is filing single this year. What is Luke’s taxable income this year? d) Calculate the amount of tax he owes using the appropriate table.

View Answer
divider
ANSWERED

Sarah Parrigin verified

Numerade educator

Below is a "map" of a county that has been broken into 5 districts. Each district has the same population. Please fill out the table based on the map and calculate the efficiency gap R Red | R Red | R Purple | R Purple | R Purple R Red | R Red | R Purple | R Purple | D Yellow R Red | R Red | R Purple | R Purple | R Yellow R Red | D Blue | R Blue | R Blue | R Yellow R Green | R Green | R Green | R Blue | R Yellow R Green | R Green | R Blue | D Blue | R Yellow D Green | R Green | R Blue | R Yellow | R Yellow District | Votes for D | Votes for R | Surplus or wasted D Votes | Surplus or wasted R Votes Red | | | | Green | | | | Blue | | | | Purple | | | | Yellow | | | | Totals | | | | The efficiency gap is (Round your percentage to 2 decimal places): %

View Answer
divider
ANSWERED

Donna Densmore verified

Numerade educator

Find the effective rate of an investment that earns 3.25% compounded weekly.

View Answer
divider
ANSWERED

Gabrielle Lee verified

Numerade educator

2. (1 pt each) 4000 dollars is invested in an account. The account collected interest over 10 years. Find the value of the investment at the end of 10 years if the interest is: (a) 5.2% compounded annually: (b) 5.2% compounded semiannually: (c) 5.2% compounded quarterly: (d) 5.2% compounded monthly: (e) 5.2% compounded daily (ignore leap years): Write either the excel command you used or the formula you used to find the answer.

View Answer
divider
INSTANT ANSWER

1. Five candidates are running for office and labeled \( A, B, C, D \) and \( E \) for simplicity. The preference schedule of votes is below. [ \( 2.5 \mathrm{pts}, 2.5 \mathrm{pts} \) ] Preference Schedule \begin{tabular}{|l|l|l|l|l|l|l|} \hline & 3 & 4 & 4 & 6 & 2 & 1 \\ \hline \( 1^{\text {st }} \) choice & B & C & B & D & B & E \\ \hline \( 2^{\text {nd }} \) choice & C & A & D & C & E & A \\ \hline \( 3^{\text {rd }} \) choice & A & D & C & A & A & D \\ \hline \( 4^{\text {th }} \) choice & D & B & A & E & C & B \\ \hline \( 5^{\text {th }} \) choice & E & E & E & B & D & C \\ \hline \end{tabular} a. Which candidate wins using the Borda Count Method? b. Which candidate wins using the Pairwise Comparison method?

View Answer
divider
ANSWERED

Donna Densmore verified

Numerade educator

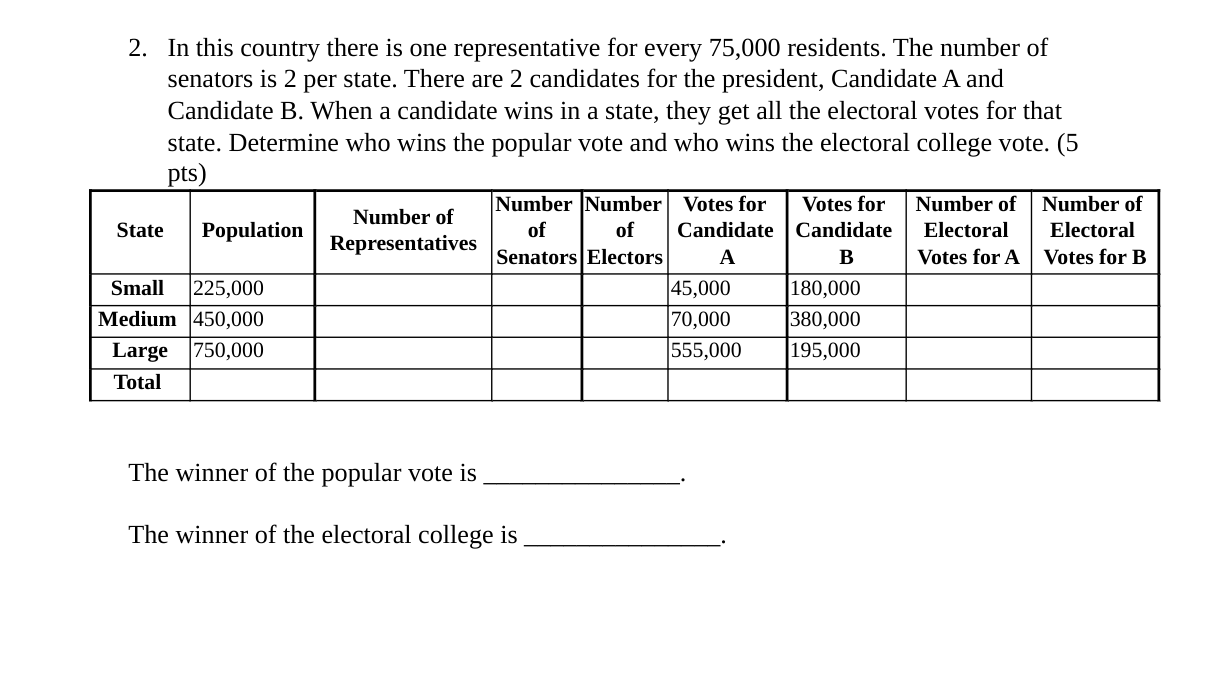
2. In this country there is one representative for every 75,000 residents. The number of senators is 2 per state. There are 2 candidates for the president, Candidate A and Candidate B. When a candidate wins in a state, they get all the electoral votes for that state. Determine who wins the popular vote and who wins the electoral college vote. (5 pts) State | Population | Number of Representatives | Number of Senators | Number of Electors | Votes for Candidate A | Votes for Candidate B | Number of Electoral Votes for A | Number of Electoral Votes for B Small | 225,000 | | | | 45,000 | 180,000 | | Medium | 450,000 | | | | 70,000 | 380,000 | | Large | 750,000 | | | | 555,000 | 195,000 | | Total | | | | | | | | The winner of the popular vote is ________. The winner of the electoral college is ________.

View Answer
divider
ANSWERED

Bobby Barnes verified

Numerade educator

Consider a small country with 4 states. The rules for the number of senators and electors are the same as the U.S. government. Each state gets 1 representative for every 50,000 residents. Determine the number of electors for each state. Then calculate the number of electoral votes per 50,000 residents for each state. Round to three decimal places. State Population Number of Representatives Number of Senators Number of Electors Number of Electors per 50,000 residents North 400000 8 2 10 6 South 100000 2 2 4 6 East 200000 4 2 6 7 West 50000 1 2 3 0 The state with the most electoral power (most votes per 50,000 residents) is the Select an answer state.

View Answer
divider
ANSWERED

Bobby Barnes verified

Numerade educator

Consider a small country with 3 states. The rules for the number of senators and electors are the same as the U.S. government. Each state gets 1 representative for every 100,000 residents. Determine the number of electors for each state. Then calculate the number of electoral votes per 100,000 residents for each state. Round to three decimal places. | State | Population | Number of Representatives | Number of Senators | Number of Electors | Electoral votes per 100,000 people | | :--- | :--- | :--- | :--- | :--- | :--- | | Red | 700000 | 7 | 2 | 9 | | | Blue | 300000 | 3 | 2 | 5 | | | Purple | 500000 | 5 | 2 | 7 | | The state with the most electoral power (most votes per 100,000 residents) is the smallest state.

View Answer
divider