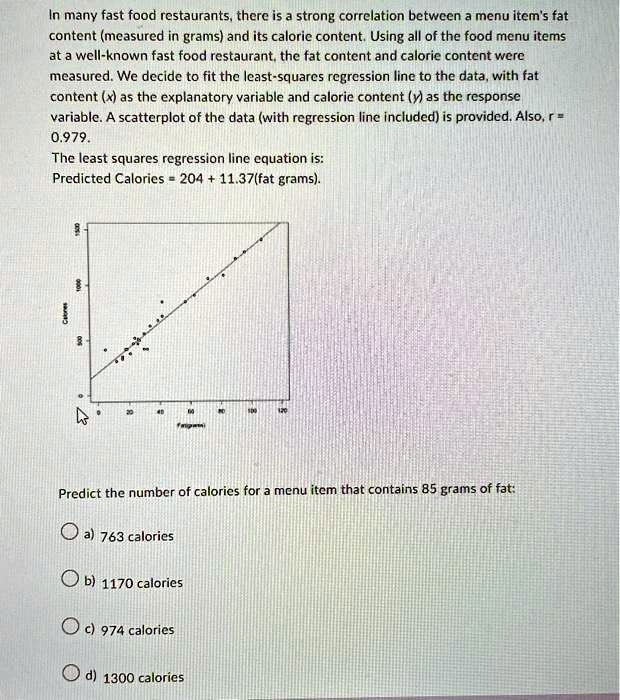
In many fast food restaurants, there is a strong correlation between a menu item's fat
content (measured in grams) and its calorie content. Using all of the food menu items
at a well-known fast food restaurant, the fat content and calorie content were
measured. We decide to fit the least-squares regression line to the data, with fat
content (x) as the explanatory variable and calorie content (y) as the response
variable. A scatterplot of the data (with regression line included) is provided. Also, r =
0.979.
The least squares regression line equation is:
Predicted Calories = 204 + 11.37(fat grams).
Predict the number of calories for a menu item that contains 85 grams of fat:
a) 763 calories
b) 1170 calories
c) 974 calories
d) 1300 calories