TABLE 10.1
Acoustic Properties of Various Materials
Characteristic Absorption
Approximate
Material Density, Speed, Impedance, Z Coefficient, $\alpha$ Frequency
p [kg m$^{-3}$] c [m s$^{-1}$] [kg m$^{-2}$ s$^{-1}$] [dB cm$^{-1}$] Dependence
(x 10$^6$) (at 1 MHz) of $\alpha$
Blood 1,060 1,570 1.62 [0.15]
Bone 1,380-1,810 4,080 3.75-7.38 [14.2-25.2]
Brain 1,030 1.55-1.66 [0.75]
Fat 920 1,450 1.35 [0.63]
Kidney 1,040 1,560 1.62
Liver 1,060 1,570 1.64-1.68 [1.2]
Lung 400 0.26 [40]
Muscle 1,070 1.65-1.74 [0.96-1.4]
Spleen 1,060 1.65-1.67
Water 1,000 1,484 1.52 [0.0022]
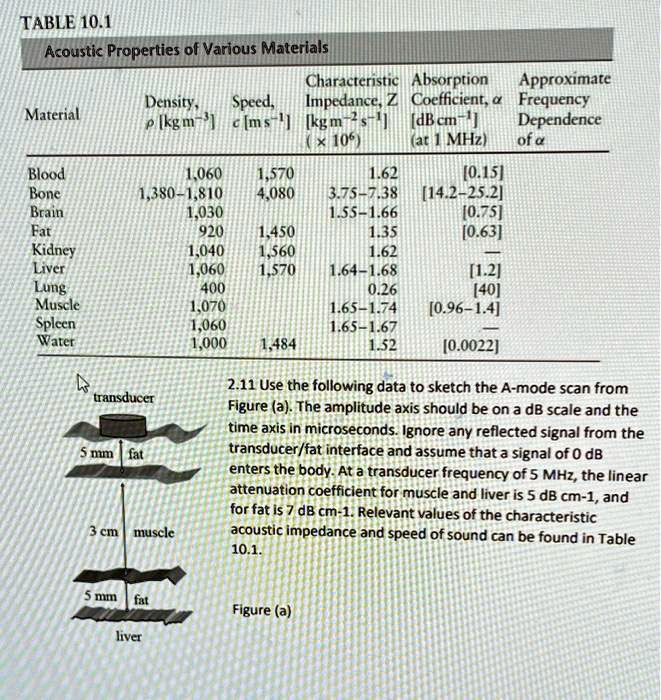
transducer
5 mm fat
3 cm muscle
2.11 Use the following data to sketch the A-mode scan from
Figure (a). The amplitude axis should be on a dB scale and the
time axis in microseconds. Ignore any reflected signal from the
transducer/fat interface and assume that a signal of 0 dB
enters the body. At a transducer frequency of 5 MHz, the linear
attenuation coefficient for muscle and liver is 5 dB cm$^{-1}$, and
for fat is 7 dB cm$^{-1}$. Relevant values of the characteristic
acoustic impedance and speed of sound can be found in Table
10.1.
5 mm fat
Figure (a)
liver