Data show that men between the ages of 20 and 29 have a mean height of 69.3 inches, with a standard deviation of 2.6 inches. A baseball analyst wonders whether the standard deviation of heights
of major-league baseball players is less than 2.6 inches. The heights (in inches) of 20 randomly selected players are shown in the table. Complete parts (a) through (c) below.
(a) Are the given data normally distributed? (Check by constructing a normal probability plot.)
A. No, the normal probability plot has a curve.
B. No, not all the data lie within the bounds of the normal probability plot.
OC. Yes, the data come from a distribution that is approximately normal.
OD. No, the plot has a curve and some of the data do not lie within the bounds.
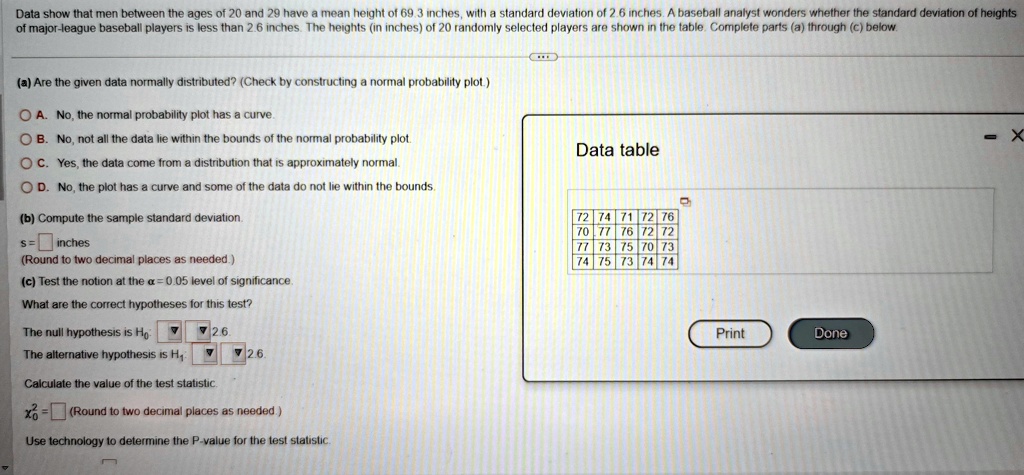
Data table
X
(b) Compute the sample standard deviation.
s= inches
(Round to two decimal places as needed.)
(c) Test the notion at the a = 0.05 level of significance.
What are the correct hypotheses for this test?
The null hypothesis is Ho
2.6.
The alternative hypothesis is H₁
▼
2.6.
Calculate the value of the test statistic.
x= (Round to two decimal places as needed.)
Use technology to determine the P-value for the test statistic.
72 74 71 72 76
70 77 76 72 72
77 73 75 70 73
74 75 73 74 74
Print
Done