Question 2
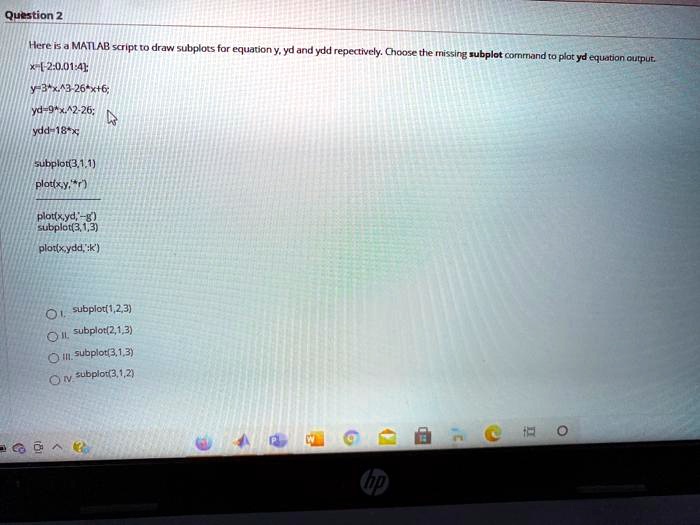
Here is a MATLAB script to draw subplots for equation y, yd and ydd repectively. Choose the missing subplot command to plot yd equation output.
x=[-2:0.01:4];
y=3*x^3-26*x+6;
yd=9*x^2-26;
ydd=18*x;
subplot(3,1,1)
plot(x,y,'*r')
plot(x,yd,'--g')
subplot(3,1,3)
plot(x,ydd,':k')
I. subplot(1,2,3)
II. subplot(2,1,3)
III. subplot(3,1,3)
IV. subplot(3,1,2)