Ace - AI Tutor
Ask Our Educators
Textbooks
My Library
Flashcards
Scribe - AI Notes
Notes & Exams
Download App
S B

S B.

Divider

Viewed Questions

Details Here are histograms for four manufactured sets of numbers. The histograms look rather different, but all four sets have the same 5 -number summary, so the boxplots for all four sets are identical to the one shown. Using these plots as examples, explain some limitations in using boxplots to describe the shape of a distribution.

Details Here are histograms for four manufactured sets of numbers. The histograms look rather different, but all four sets have the same 5 -number summary, so the boxplots for all four sets are identical to the one shown. Using these plots as examples, explain some limitations in using boxplots to describe the shape of a distribution.

Stats Data and Models

Each of these four scatterplots shows a cluster of points and one "stray" point. For each, answer these questions:
1) In what way is the point unusual? Does it have high leverage, a large residual, or both?
2) Do you think that point is an influential point?
3) If that point were removed, would the correlation become stronger or weaker? Explain.
4) If that point were removed, would the slope of the regression line increase or decrease? Explain.

Each of these four scatterplots shows a cluster of points and one "stray" point. For each, answer these questions: 1) In what way is the point unusual? Does it have high leverage, a large residual, or both? 2) Do you think that point is an influential point? 3) If that point were removed, would the correlation become stronger or weaker? Explain. 4) If that point were removed, would the slope of the regression line increase or decrease? Explain.

Stats Data and Models

Grocery shopping Many grocery store chains offer customers a card they can scan when they check out and offer discounts to people who do so. To get the card, customers must give information, including a mailing address and e-mail address. The actual purpose is not to reward loyal customers but to gather data. What data do these cards allow stores to gather, and why would they want that data?

Grocery shopping Many grocery store chains offer customers a card they can scan when they check out and offer discounts to people who do so. To get the card, customers must give information, including a mailing address and e-mail address. The actual purpose is not to reward loyal customers but to gather data. What data do these cards allow stores to gather, and why would they want that data?

Stats Data and Models

A presidential candidate fears he has a problem with women voters. His campaign staff plans to run a poll to assess the situation. They'll randomly sample 350 men and 350 women, asking if they have a favorable impression of the candidate. Obviously, the staff can't know this, but suppose the candidate has a positive image with $62 \%$ of males but with only $57 \%$ of females.
a) What kind of sampling design is his staff planning to use?
b) What difference would you expect the poll to show?
c) Of course, sampling error means the poll won't reflect the difference perfectly. What's the standard deviation for the difference in the proportions?
d) Sketch a sampling model for the size difference in proportions of men and women with favorable impressions of this candidate that might appear in a poll like this.
e) Could the campaign be misled by the poll, concluding that there really is no gender gap? Explain.

A presidential candidate fears he has a problem with women voters. His campaign staff plans to run a poll to assess the situation. They'll randomly sample 350 men and 350 women, asking if they have a favorable impression of the candidate. Obviously, the staff can't know this, but suppose the candidate has a positive image with $62 \%$ of males but with only $57 \%$ of females. a) What kind of sampling design is his staff planning to use? b) What difference would you expect the poll to show? c) Of course, sampling error means the poll won't reflect the difference perfectly. What's the standard deviation for the difference in the proportions? d) Sketch a sampling model for the size difference in proportions of men and women with favorable impressions of this candidate that might appear in a poll like this. e) Could the campaign be misled by the poll, concluding that there really is no gender gap? Explain.

Stats Data and Models

Questions asked

INSTANT ANSWER

lights. The environmental group takes a simple random sample of 112 small businesses in the Downtown business district and finds that 34 do not use energy-efficient lights. Part 1 a. The proportion of the 112 small businesses in Downtown business district that do not use energy-efficient lights, \( \frac{34}{112} \), is a (O) A. statistic B. variable of interest c. parameter b. Use the sample data to compute a \( 95 \% \) confidence interval for the true proportion of small businesses in the Downtown business district that do not use energy-efficient lights. (Please carry answers to at least six decimal places in intermediate steps. Give your final answer to the nearest three decimal places). \( 95 \% \) confidence interval \( =(0.22 \) Part 2 a. If many random samples of 112 Downtown small businesses are drawn, \( 95 \% \) of the resulting confidence intervals will contain the value \( \frac{34}{112} \). True \( V \) c. There is a \( 95 \% \) probability that the true proportion of Downtown small businesses that do not use energy-efficient lights equals \( \frac{34}{112} \). True \( V \) e. \( 30.36 \%\left(\frac{34}{112}\right) \) of Downtown small businesses do not use energy-efficient light. True \( \quad \) Part 3 six decimal places in intermediate steps. 929

View Answer
divider
ANSWERED

Keondre Parker verified

Numerade educator

3. In this question, we will focus on a study that investigates the connection between smoking habit and four particular occupations (doctors, teachers, engineers and workers). When recruiting individuals to participate in this study, the researcher selected a simple random sample of individuals from each of the four occupations. The data is given in the table below. Smoking | Doctor | Teacher | Engineer | Worker Yes | 5 | 10 | 15 | 27 No | 82 | 86 | 50 | 35 For parts that involve probability calculations, please give your final answers to two decimal places. You must show and explain your steps in order to receive full credits.

View Answer
divider
INSTANT ANSWER

According to Statistics Canada's 2006 "Participation and Activity Limitation Survey," out of a Canadian population of 25.4 million aged 15 and over, 1.3 million people have some hearing loss. The study also suggested that \( 19 \% \) of Canadians with some degree of hearing loss use an assistive device such as a hearing aid. Let us suppose that a new study takes a simple random sample of size 150 from all Canadians over 15 with hearing loss and that within this sample, 35 people use some assistive device. (a) What is a parameter of interest in this study? A. The proportion in the sample who use an assistive device for their hearing. B. All Canadians over 15. C. The proportion of all Canadians over 15 who have some degree of hearing loss. D. Whether a Canadian over 15 who has some degree of hearing loss uses an assistive device for their hearing. E. The proportion of Canadians who use some assistive device for their hearing among those who are over 15 and have some degree of hearing loss. (b) What is the observed sample proportion here (to three decimal places)? (c) Under the hypothesis that the parameter identified in part (a) has not changed since the earlier study, what is the approximate sampling distribution of the sample proportion? A. \( N(35 / 150, \sqrt{35 / 150 \times(1-35 / 150) / 150}) \) B. \( N(0.19, \sqrt{0.19 \times 0.81 / 150}) \) C. \( N(35 / 150, \sqrt{0.19 \times 0.81 / 150}) \) D. \( N(0.19, \sqrt{0.19 \times 0.81 / 35}) \) E. \( N(0.19, \sqrt{35 / 150 \times(1-35 / 150) / 150}) \) (d) Suppose Statistics Canada repeatedly took samples of size 150 from the population of Canadians over the age of 15 with hearing loss. Assuming the conditions in (c), in approximately what percentage (to two decimal places) of such samples would you expect to see the proportion of individuals in the sample using assistive devices being greater than 0.25 ? Use the 68-95-99.7 Rule to answer this question.

View Answer
divider
ANSWERED

Oluwadamilola Ameobi verified

Numerade educator

Suppose we are looking at a large database of the English language such as the IPhOD dictionary (Vaden . 2009). For any word we select, there is an 81% probability that it starts with a consonant and a 19% probability that it starts with a vowel. If it starts with a consonant, there is a 21% chance that the second sound is also a consonant, while if the word starts with a vowel, there is a 99% chance that the second sound is a consonant. (These probabilities were calculated using the "Phonological Search" function of the free software Phonological CorpusTools, by Hall . 2015). Give answers to the following to two decimals places.

View Answer
divider
ANSWERED

Jerelyn Nevil verified

Numerade educator

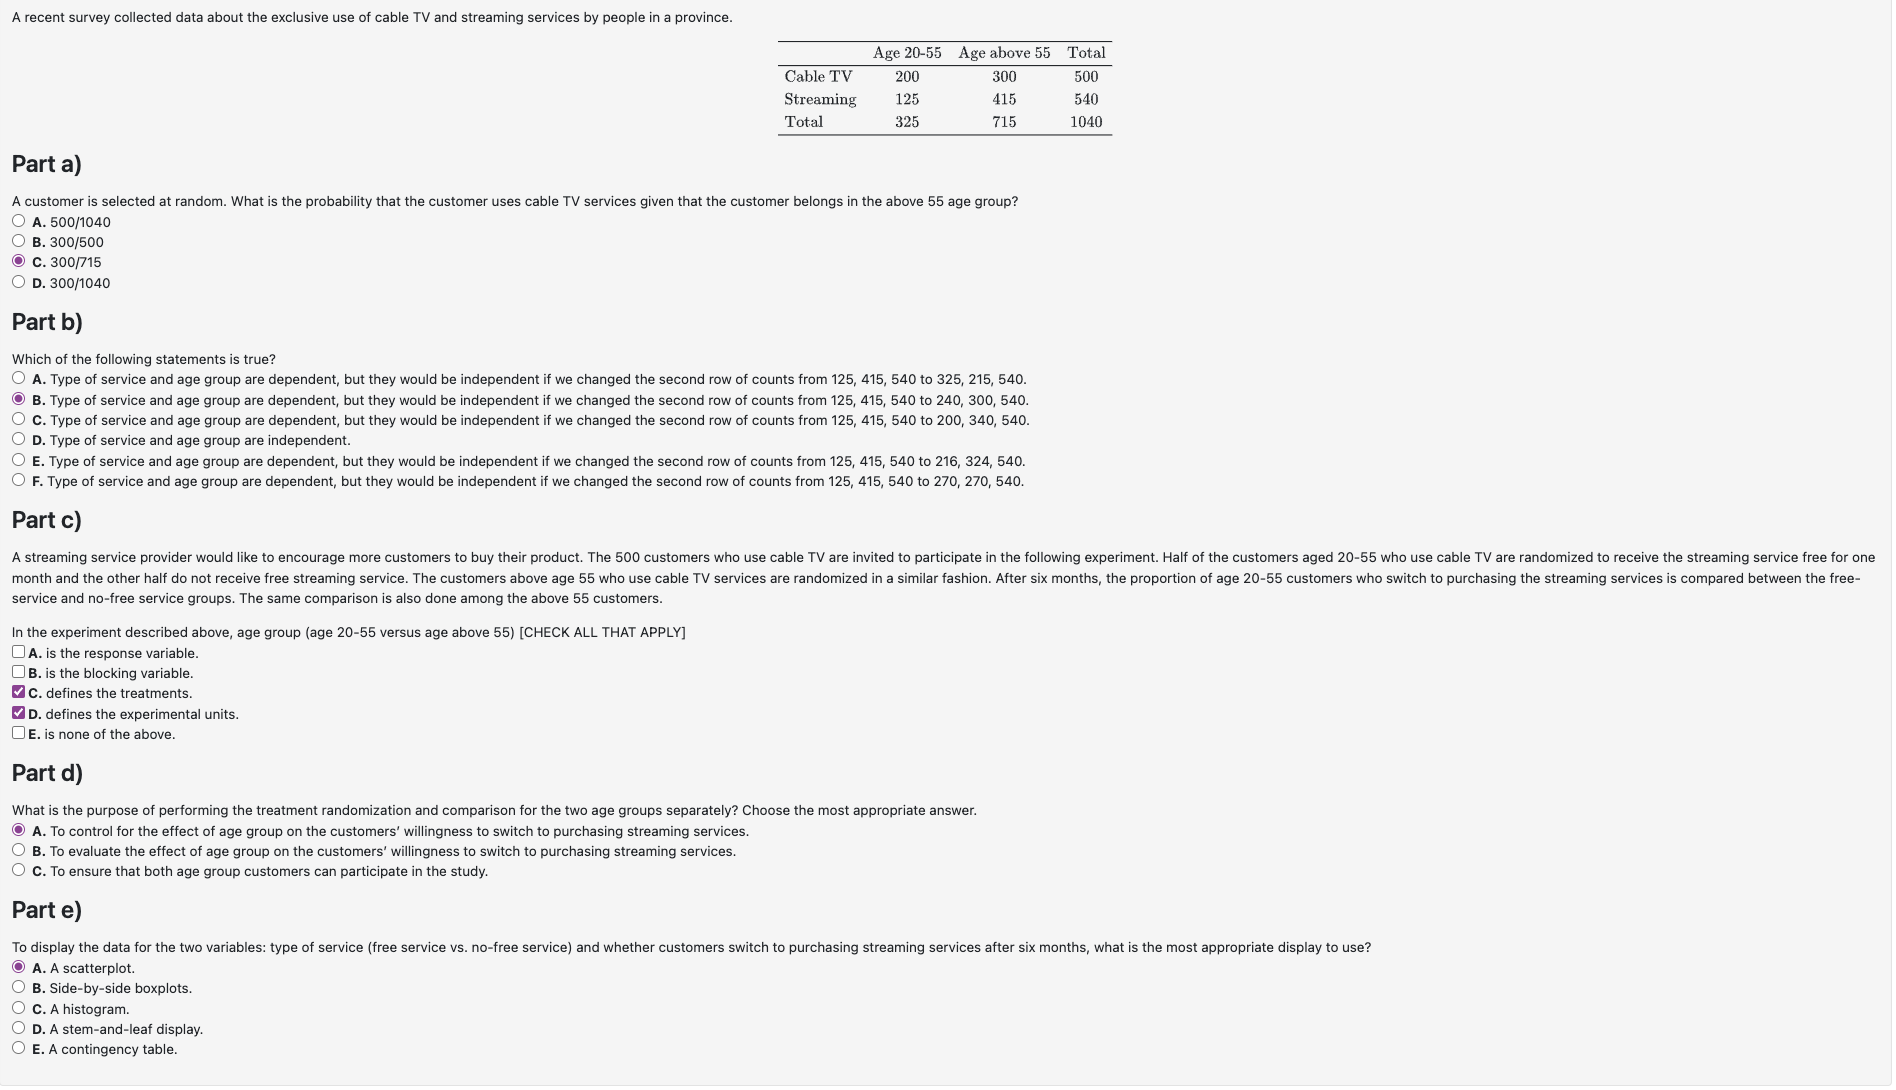
A recent survey collected data about the exclusive use of cable TV and streaming services by people in a province. Age 20-55 Age above 55 Total Cable TV 200 300 500 Streaming 125 415 540 Total 325 715 1040 Part a) A customer is selected at random. What is the probability that the customer uses cable TV services given that the customer belongs in the above 55 age group? A. 500/1040 B. 300/500 C. 300/715 D. 300/1040 Part b) Which of the following statements is true? A. Type of service and age group are dependent, but they would be independent if we changed the second row of counts from 125, 415, 540 to 325, 215, 540. B. Type of service and age group are dependent, but they would be independent if we changed the second row of counts from 125, 415, 540 to 240, 300, 540. C. Type of service and age group are dependent, but they would be independent if we changed the second row of counts from 125, 415, 540 to 200, 340, 540. D. Type of service and age group are independent. E. Type of service and age group are dependent, but they would be independent if we changed the second row of counts from 125, 415, 540 to 216, 324, 540. F. Type of service and age group are dependent, but they would be independent if we changed the second row of counts from 125, 415, 540 to 270, 270, 540. Part c) A streaming service provider would like to encourage more customers to buy their product. The 500 customers who use cable TV are invited to participate in the following experiment. Half of the customers aged 20-55 who use cable TV are randomized to receive the streaming service free for one month and the other half do not receive free streaming service. The customers above 55 who use cable TV services are randomized in a similar fashion. After six months, the proportion of age 20-55 customers who switch to purchasing the streaming services is compared between the free-service and no-free service groups. The same comparison is also done among the above 55 customers. In the experiment described above, age group (age 20-55 versus age above 55) [CHECK ALL THAT APPLY] A. is the response variable. B. is the blocking variable. C. defines the treatments. D. defines the experimental units. E. is none of the above. Part d) What is the purpose of performing the treatment randomization and comparison for the two age groups separately? Choose the most appropriate answer. A. To control for the effect of age group on the customers' willingness to switch to purchasing streaming services. B. To evaluate the effect of age group on the customers' willingness to switch to purchasing streaming services. C. To ensure that both age group customers can participate in the study. Part e) To display the data for the two variables: type of service (free service vs. no-free service) and whether customers switch to purchasing streaming services after six months, what is the most appropriate display to use? A. A scatterplot. B. Side-by-side boxplots. C. A histogram. D. A stem-and-leaf display. E. A contingency table.

View Answer
divider