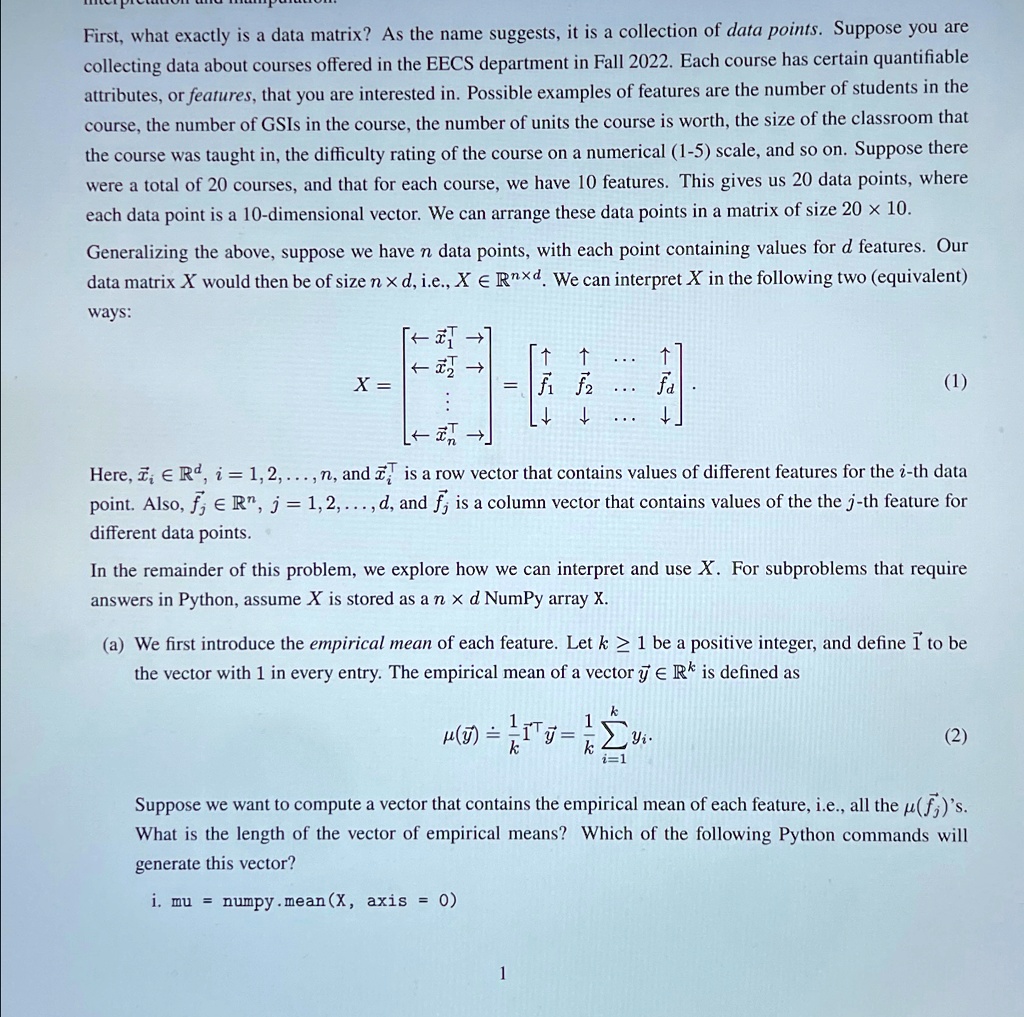
First, what exactly is a data matrix? As the name suggests, it is a collection of data points. Suppose you are collecting data about courses offered in the EECS department in Fall 2022. Each course has certain quantifiable attributes, or features, that you are interested in. Possible examples of features are the number of students in the course, the number of GSIs in the course, the number of units the course is worth, the size of the classroom that the course was taught in, the difficulty rating of the course on a numerical (1-5) scale, and so on. Suppose there were a total of 20 courses, and that for each course, we have 10 features. This gives us 20 data points, where each data point is a 10-dimensional vector. We can arrange these data points in a matrix of size 20 imes 10.
Generalizing the above, suppose we have n data points, with each point containing values for d features. Our data matrix x would then be of size n imes d, i.e., xinR^(n imes d). We can interpret x in the following two (equivalent) ways:
x=[[larrvec(x)_(1)^(TT)->],[larrvec(x)_(2)^(TT)->],[vdots],[larrvec(x)_(n)^(TT)->]]=[[uarr,uarr,dots,uarr],[vec(f)_(1),vec(f)_(2),dots,vec(f)_(d)],[darr,darr,dots,darr]]
Here, vec(x)_(i)inR^(d),i=1,2,dots,n, and vec(x)_(i)^(TT) is a row vector that contains values of different features for the i-th data point. Also, vec(f)_(j)inR^(n),j=1,2,dots,d, and vec(f_(j)) is a column vector that contains values of the the j-th feature for different data points.
In the remainder of this problem, we explore how we can interpret and use x. For subproblems that require answers in Python, assume x is stored as a n imes d NumPy array x.
(a) We first introduce the empirical mean of each feature. Let k>=1 be a positive integer, and define vec(1) to be the vector with 1 in every entry. The empirical mean of a vector vec(y)inR^(k) is defined as
mu (vec(y))≐(1)/(k)vec(1)^(TT)vec(y)=(1)/(k)sum_(i=1)^k y_(i).
Suppose we want to compute a vector that contains the empirical mean of each feature, i.e., all the mu (vec(f_(j))) 's. What is the length of the vector of empirical means? Which of the following Python commands will generate this vector?
i. mu = numpy * mean , axis =0
1
First, what exactly is a data matrix? As the name suggests, it is a collection of data points. Suppose you are collecting data about courses offered in the EECS department in Fall 2022. Each course has certain quantifiable attributes, or features, that you are interested in. Possible examples of features are the number of students in the course, the number of GSIs in the course, the number of units the course is worth, the size of the classroom that the course was taught in, the difficulty rating of the course on a numerical (1-5) scale, and so on. Suppose there were a total of 20 courses, and that for each course, we have 10 features. This gives us 20 data points, where each data point is a 10-dimensional vector. We can arrange these data points in a matrix of size 20 10. Generalizing the above, suppose we have n data points, with each point containing values for d features. Our data matrix X would then be of size n d, i.e., X e IRn d. We can interpret X in the following two (equivalent) ways: [T-] t FI- T =X fi f2 fa (1) 1 -]
Here, R, i = 1,2,...,n, and is a row vector that contains values of different features for the i-th data point. Also, f, e Rn, j = 1, 2,...,d, and f, is a column vector that contains values of the the j-th feature for different data points.
In the remainder of this problem, we explore how we can interpret and use X. For subproblems that require answers in Python, assume X is stored as a n d NumPy array X.
(a) We first introduce the empirical mean of each feature. Let k 1 be a positive integer, and define 1 to be the vector with 1 in every entry.The empirical mean of a vector E Ris defined as
(=1=y
(2)
Suppose we want to compute a vector that contains the empirical mean of each feature, i.e., all the (f,)'s What is the length of the vector of empirical means?Which of the following Python commands will generate this vector?
i.mu =numpy.meanXaxis=0
1