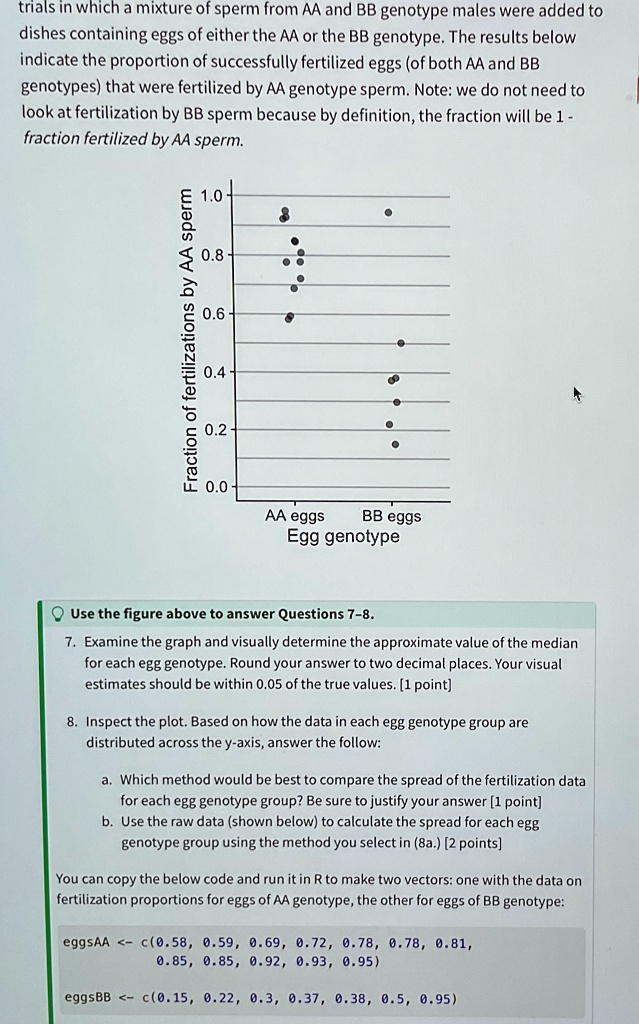
trials in which a mixture of sperm from AA and BB genotype males were added to
dishes containing eggs of either the AA or the BB genotype. The results below
indicate the proportion of successfully fertilized eggs (of both AA and BB
genotypes) that were fertilized by AA genotype sperm. Note: we do not need to
look at fertilization by BB sperm because by definition, the fraction will be 1 -
fraction fertilized by AA sperm.
1.0
0.8
Fraction of fertilizations by AA sperm
0.6
0.4
0.2
0.0
AA eggs
BB eggs
Egg genotype
Use the figure above to answer Questions 7-8.
7. Examine the graph and visually determine the approximate value of the median
for each egg genotype. Round your answer to two decimal places. Your visual
estimates should be within 0.05 of the true values. [1 point]
8. Inspect the plot. Based on how the data in each egg genotype group are
distributed across the y-axis, answer the follow:
a. Which method would be best to compare the spread of the fertilization data
for each egg genotype group? Be sure to justify your answer [1 point]
b. Use the raw data (shown below) to calculate the spread for each egg
genotype group using the method you select in (8a.) [2 points]
You can copy the below code and run it in R to make two vectors: one with the data on
fertilization proportions for eggs of AA genotype, the other for eggs of BB genotype:
eggsAA <- c(0.58, 0.59, 0.69, 0.72, 0.78, 0.78, 0.81,
\hspace{1cm}0.85, 0.85, 0.92, 0.93, 0.95)
eggsBB <- c(0.15, 0.22, 0.3, 0.37, 0.38, 0.5, 0.95)