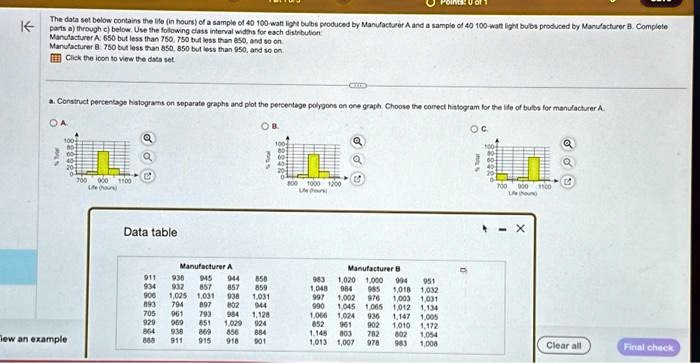
Texts: The data set below contains the number of hours of a sample of 40 100-watt light bulbs produced by Manufacturer parts A through C below. Use the following class interval widths for each distribution: Manufacturer A: 650 but less than 750, 750 up to but less than 850, and so on. Click the icon to view the data set.
Manufacturer B: Complete histograms on separate graphs for the number of hours of bulbs for Manufacturer A and Manufacturer B.
OA
OB
a
OC
X a
1100
1200 Open
700
Data table
X
Manufacturer A
Manufacturer B 983 1,020 1,000 994 951 1,048 984 985 1,061 1,024 EEBEBBE 852 1,148 1,013 1,007 978
858 859 1,031 944
1,025 1,031 897 628885 915 918 901
ew an example
Clear all
Final check