I have this code in Python, which is the theoretical expected value. Can someone help me and write a code in PYTHON that will explain the following question: Which function can be used to fit the data? Calculate the fitting parameters and compare them with the theoretical expected value. Hint: You do not need to use the full numerical expression, it is enough to only use two free parameters in the fit (a constant and the exponent).
```python
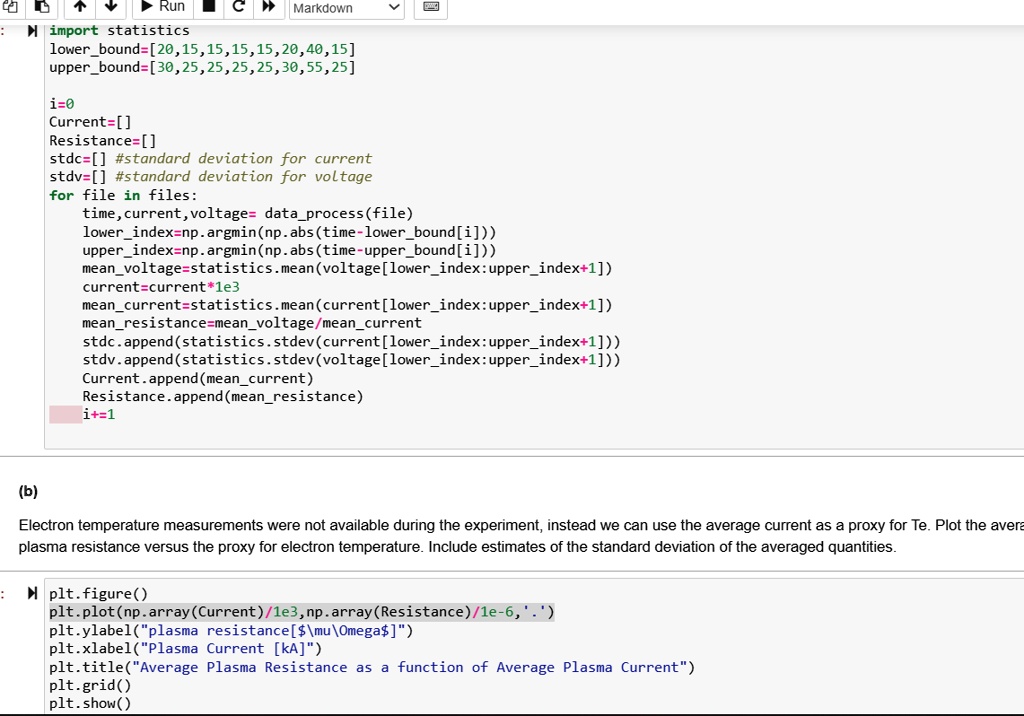
import statistics
lower_bound = [20, 15, 15, 15, 15, 20, 40, 15]
upper_bound = [30, 25, 25, 25, 25, 30, 55, 25]
i = 0
Current = []
Resistance = []
stdc = [] # standard deviation for current
stdv = [] # standard deviation for voltage
for file in files:
time, current, voltage = data_process(file)
lower_index = np.argmin(np.abs(time - lower_bound[i]))
upper_index = np.argmin(np.abs(time - upper_bound[i]))
mean_voltage = statistics.mean(voltage[lower_index:upper_index+1])
current = current * 1e3
mean_current = statistics.mean(current[lower_index:upper_index+1])
mean_resistance = mean_voltage / mean_current
stdc.append(statistics.stdev(current[lower_index:upper_index+1]))
stdv.append(statistics.stdev(voltage[lower_index:upper_index+1]))
Current.append(mean_current)
Resistance.append(mean_resistance)
i += 1
# (q) plasma resistance versus the proxy for electron temperature.
# Include estimates of the standard deviation of the averaged quantities
plt.figure
plt.plot(np.array(Current) / 1e3, np.array(Resistance) / 1e-6, '.')
plt.ylabel("plasma resistance [$muOmega$]")
plt.xlabel("plasma Current [kA]")
plt.title("Average Plasma Resistance as a function of Average Plasma Current")
plt.grid()
plt.show()
```