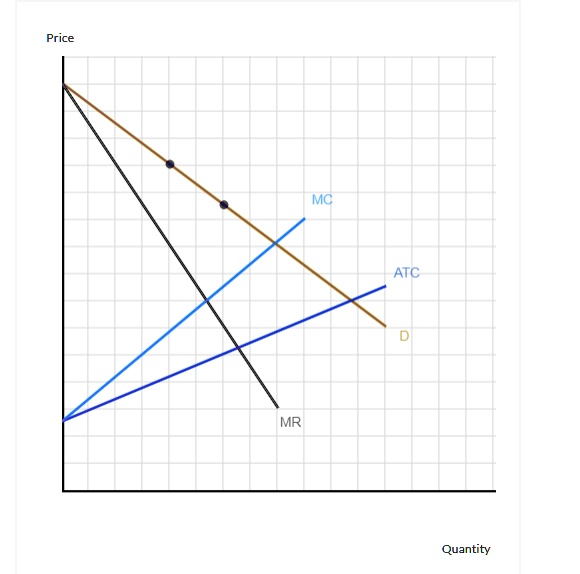
The graph shows the demand (D), marginal cost (MC), marginal revenue (MR), and average total cost (ATC) curves for a firm that is a price maker for its product. The MC and ATC curves slope upward because one of the materials used to make the product is scarce. The firm can obtain a small supply cheaply, but additional units get more and more expensive. If the firm is able to practice price discrimination, using the two prices indicated by the two points indicated on the demand curve, use the area tool to outline the region that represents the net revenue (total revenue minus total costs). Use just one region to outline the net revenue. The lower boundary of this region should run horizontally. रualility
Price
MC
ATC
D
MR
Quantity