How did he get the P-value shown here? Could show me the detailed step by step process?
100 50
60
70
80
90
Weight(kg)
1
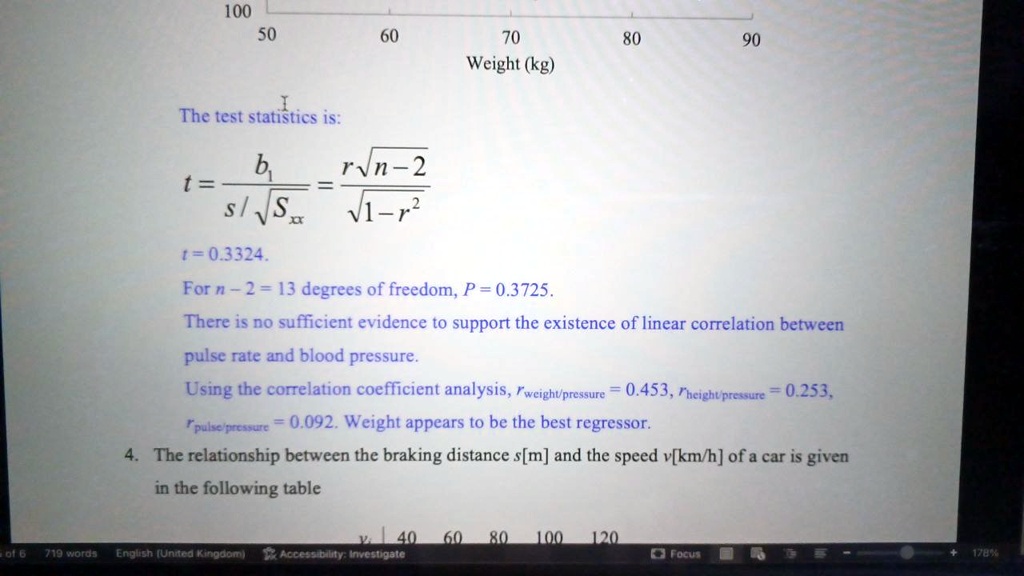
The test statistics is:
b
rn-2
t=
S/
t=0.3324
For n-2=13degrees of freedom,P=0.3725 There is no sufficient evidence to support the existence of linear correlation between pulse rate and blood pressure. Using the correlation coefficient analysis, rweighpressure =0.453, rheighvpressure=0.253, rpulsepressure =0.092. Weight appears to be the best regressor. 4. The relationship between the braking distance s[m] and the speed v[km/h] of a car is given in the following table
60 80 100 120
90
719 words
Focus