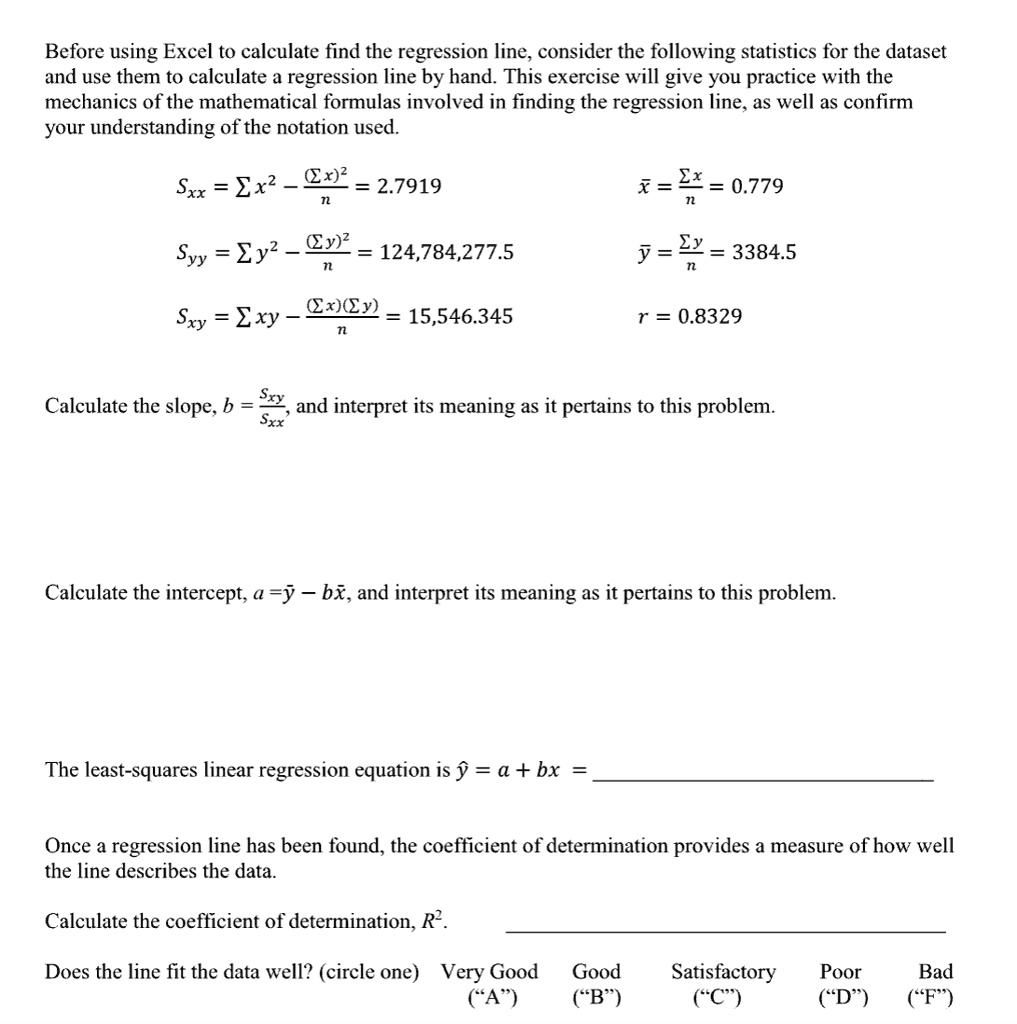
Before using Excel to calculate find the regression line, consider the following statistics for the dataset and use them to calculate a regression line by hand. This exercise will give you practice with the mechanics of the mathematical formulas involved in finding the regression line, as well as confirm your understanding of the notation used.\\
$S_{xx} = \sum x^2 - \frac{(\sum x)^2}{n} = 2.7919$\\
$S_{yy} = \sum y^2 - \frac{(\sum y)^2}{n} = 124,784,277.5$\\
$S_{xy} = \sum xy - \frac{(\sum x)(\sum y)}{n} = 15,546.345$\\
$\bar{x} = \frac{\sum x}{n} = 0.779$\\
$\bar{y} = \frac{\sum y}{n} = 3384.5$\\
r = 0.8329\\Calculate the slope, $b = \frac{S_{xy}}{S_{xx}}$, and interpret its meaning as it pertains to this problem.\\Calculate the intercept, $a = \bar{y} - b\bar{x}$, and interpret its meaning as it pertains to this problem.\\The least-squares linear regression equation is $\hat{y} = a + bx = $\\Once a regression line has been found, the coefficient of determination provides a measure of how well the line describes the data.\\Calculate the coefficient of determination, $R^2$.\\Does the line fit the data well? (circle one) Very Good ("A") Good ("B") Satisfactory ("C") Poor ("D") Bad ("F")