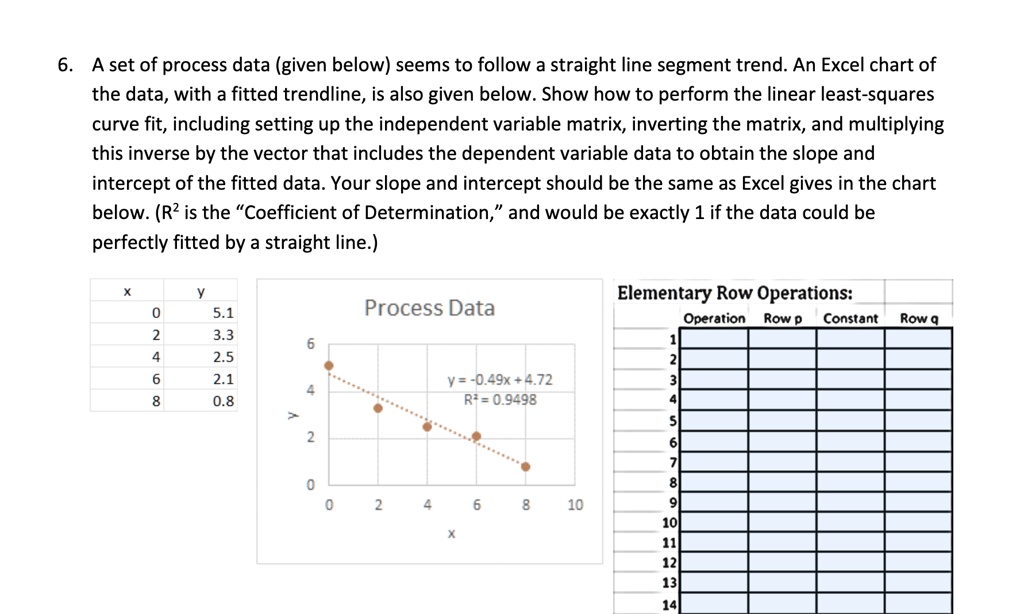
6. A set of process data (given below) seems to follow a straight line segment trend. An Excel chart of
the data, with a fitted trendline, is also given below. Show how to perform the linear least-squares
curve fit, including setting up the independent variable matrix, inverting the matrix, and multiplying
this inverse by the vector that includes the dependent variable data to obtain the slope and
intercept of the fitted data. Your slope and intercept should be the same as Excel gives in the chart
below. ($R^2$ is the \"Coefficient of Determination,\" and would be exactly 1 if the data could be
perfectly fitted by a straight line.)
Elementary Row Operations:
Operation Row p Constant Row q
X y
0 5.1
2 3.3
4 2.5
6 2.1
8 0.8
Process Data
6
4
y = -0.49x + 4.72
$R^2$ = 0.9498
2
0
0 2 4 6 8 10
X
1
2
3
4
5
6
7
8
9
10
11
12
13
14