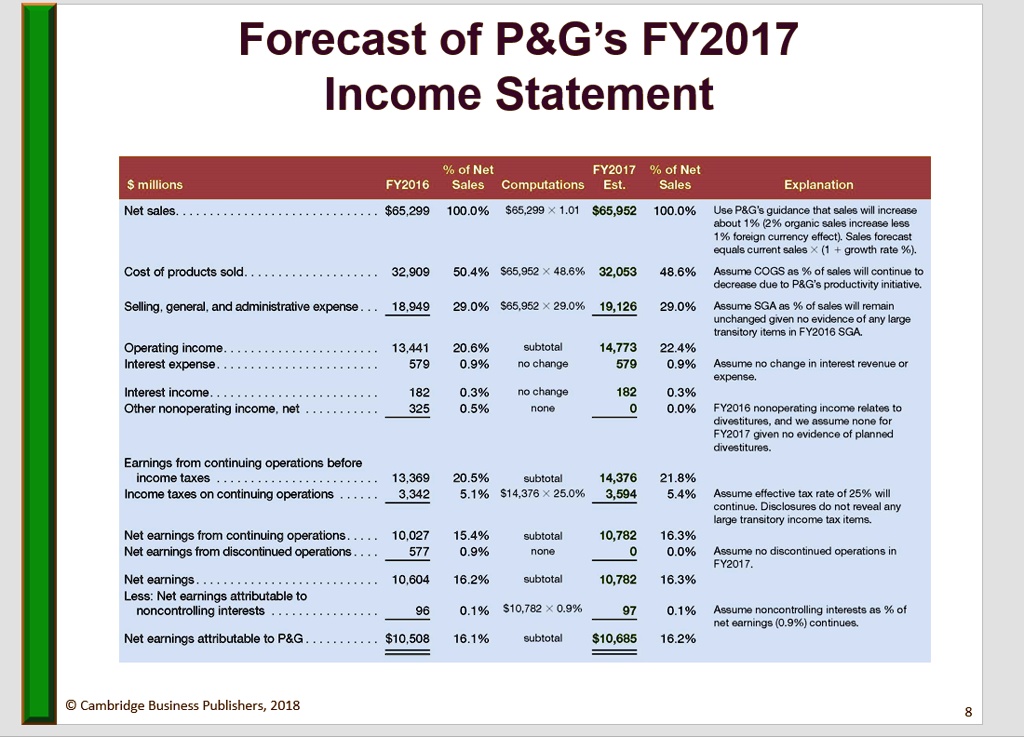
Forecast the Income Statement. Use the sales growth assumption to forecast sales for the next fiscal year. Use cost-level assumptions to forecast all the operating expenses. At this first stage, we typically leave non-operating expenses and revenues unchanged from prior-year dollar levels. We return to fine-tune these after we forecast the balance sheet.
For your forecasting, please use the % of sales revenue method.
For I/S forecasting, please follow the format shown in PPT slides #8 and 26
The forecasting period is for 5 years (4 years of horizontal period + 1 year of terminal period).
For the first 4 years, you can use the historical sales revenue growth rate.
For the terminal year, assume the natural sales revenue growth rate of2%.
Forecast of P&G's FY2017
Income Statement
% of Net FY2017 %of Net S millions FY2016 Sales Computations Est. Sales Explanation Net sales. $65,299 100.0% $65,299 1.01 $65,952 100.0% Use P&G's guidance that sales will increase about 1% (2% organic sales increase less 1% foreign currency effect). Sales forecast equals current sales (1 + growth rate %). Cost of products sold. 32,909 50.4%$65,952 48.6% 32,053 48.6% Assume COGS as % of sales will continue to decrease due to P&G's productivity initiative. Selling. general, and administrative expense .. 18,949 29.0% $65,952 29.0% 19,126 29.0% Assume SGA as % of sales will remain unchanged given no evidence of any large transitory items in FY2016 SGA. Operating income. 13,441 20.6% subtotal 14,773 22.4% Interest expense.. 579 0.9% no change 579 0.9% Assume no change in interest revenue or expense. Interest income.. 182 0.3% no change 182 0.3% Other nonoperating income, net 325 0.5% none 0 0.0% FY2016 nonoperating income relates to divestitures, and we assume none for FY2017 given no evidence of planned divestitures. Earnings from continuing operations before income taxes. 13,369 20.5% subtotal 14,376 21.8% Income taxes on continuing operations 3,342 5.1% $14,376 25.0% 3,594 5.4% Assume effective tax rate of 25% will continue. Disclosures do not reveal any large transitory income tax items. Net earnings from continuing operations 10,027 15.4% subtotal 10,782 16.3% Net earnings from discontinued operations.. 577 0.9% none 0 0.0% Assume no discontinued operations in FY2017. Net earnings.. 10,604 16.2% subtotal 10,782 16.3% Less: Net earnings attributable to noncontrolling interests... 96 0.1% $10,782 0.9% 97 0.1% Assume noncontrolling interests as % of net earnings (0.9%) continues. Net earnings attributable to P&G $10,508 16.1% subtotal $10,685 16.2%
Cambridge Business Publishers, 2018
8