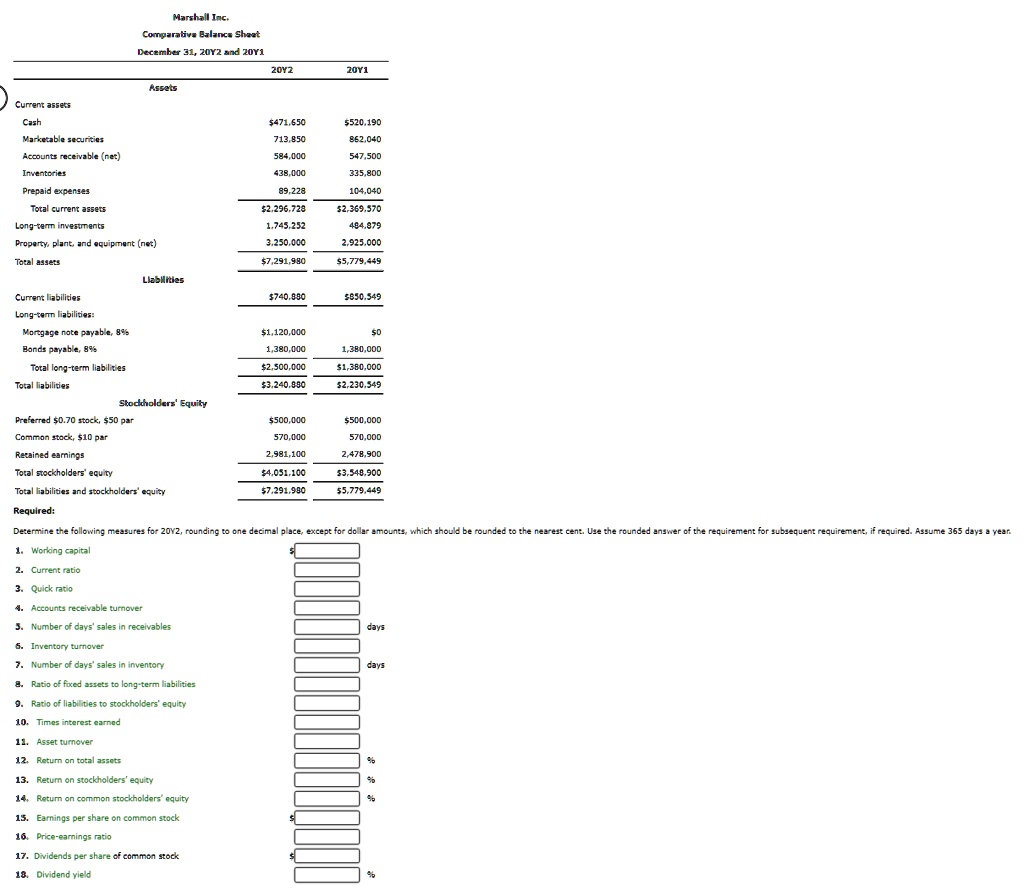
Marshall Inc.
Comparative Balance Sheet December 31, 20Y2 and 20Y1
20Y2 Assets
Current assets
Cash
Marketable securities
Accounts receivable (net)
Inventories
Prepaid expenses
Total current assets
Long-term investments
Property, plant, and equipment (net)
Total assets
20Y1
$471,650
713,850
584,000
438,000
$520,190
862,040
547,500
335,800
104,040
$2,369,570
484,879
2,925,000
$5,779,449
Liabilities
Current liabilities
Long-term liabilities:
Mortgage note payable, 8%
Bonds payable, 8%
Total long-term liabilities
Total liabilities
Stockholders' Equity
Preferred $0.70 stock, $50 par
Common stock, $10 par
Retained earnings
Total stockholders' equity
Total liabilities and stockholders equity
$2,296,728
1,745,252
3,250,000
$7,291,980
$740,890
$950,549
$1,120,000
1,380,000
$2,500,000
$3,240,880
$0
1,380,000
$1,380,000
$2,230,549
$500,000
570,000
2,981,100
$4,051,100
$7,291,980
$500,000
570,000
2,478,900
$3,548,900
$5,779,449
Determine the following measures for 20Y2, rounding to one decimal place, except for dollar amounts, which should be rounded to the nearest cent. Use the rounded answer of the requirement for subsequent requirement, if required. Assume 365 days a year.
1. Working capital
2. Current ratio
3. Quick ratio
4. Accounts receivable turnover
5. Number of days' sales in receivables
6. Inventory turnover
7. Number of days' sales in inventory
8. Ratio of fixed assets to long-term liabilities
9. Ratio of liabilities to stockholders' equity
10. Times interest earned
11. Asset turnover
12. Return on total assets
13. Return on stockholders equity
14. Return on common stockholders equity
15. Earnings per share on common stock
16. Price-earnings ratio
17. Dividends per share of common stock
18. Dividend yield