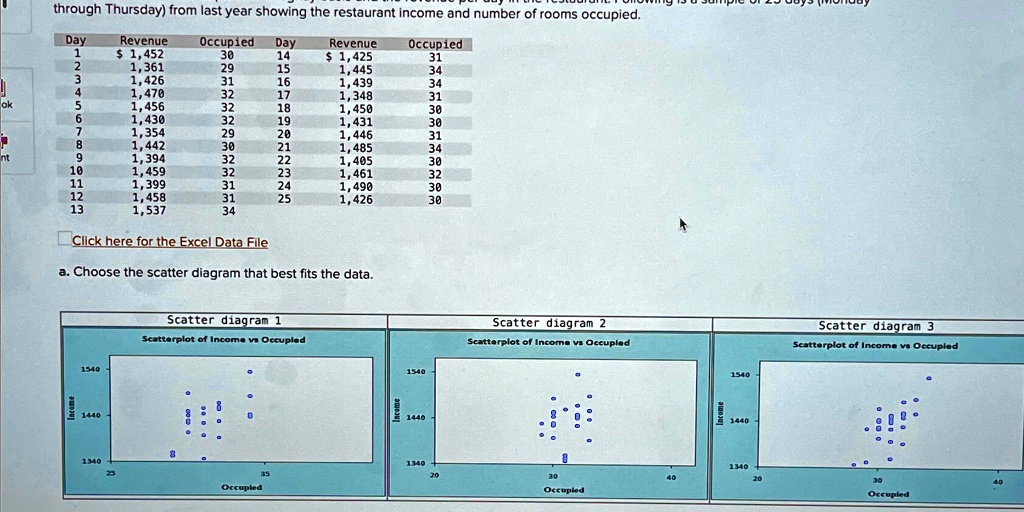
through Thursday) from last year showing the restaurant income and number of rooms occupied.
Day
Revenue
Occupied
Day
Revenue
Occupied
1
$ 1,452
30
14
$ 1,425
31
2
1,361
29
15
1,445
34
3
1,426
31
16
1,439
34
4
1,470
32
17
1,348
31
5
1,456
32
18
1,450
30
6
1,430
32
19
1,431
30
7
1,354
29
20
1,446
31
8
1,442
30
21
1,485
34
9
1,394
32
22
1,405
30
10
1,459
32
23
1,461
32
11
1,399
31
24
1,490
30
12
1,458
31
25
1,426
30
13
1,537
34
Click here for the Excel Data File
a. Choose the scatter diagram that best fits the data.
Scatter diagram 1
Scatterplot of Income vs Occupied
Income
1540
1440
1340
25
35
Occupied
Income
1540
1440
Scatter diagram 2
Scatterplot of Income vs Occupied
1340
20
30
40
Occupied
Income
1540
1440
Scatter diagram 3
Scatterplot of Income vs Occupied
1340
20
30
40
Occupied