Ace - AI Tutor
Ask Our Educators
Textbooks
My Library
Flashcards
Scribe - AI Notes
Notes & Exams
Download App
trinidad huynh

trinidad h.

Divider

Questions asked

BEST MATCH

Question Part 1 of 2 Completed: 5 of 8 My score: 5.5/8 pts (68.75%) Save The January 22, 2008, press release of the Federal Open Market Committee (FOMC) states that the FOMC "decided to lower its target for the federal funds rate by 75 basis points to 3½ percent." The press release goes on to say that "in a related action the Board of Governors approved a 75-basis point decrease in the discount rate to 4 percent." Source: Board of Governors of the Federal Reserve System, "Press Release," January 22, 2008. www.federalreserve.gov news/events/press/monetary/20080122b.htm. 
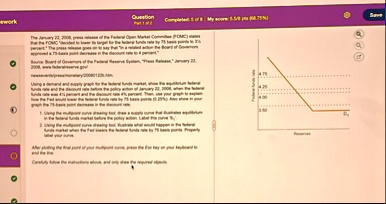
Using a demand and supply graph for the federal funds market, show the equilibrium federal funds rate and the discount rate before the policy action of January 22, 2008, when the federal funds rate was 4% percent and the discount rate 4% percent. Then, use your graph to explain how the Fed would lower the federal funds rate by 75 basis points (0.75%). Also show in your graph the 75-basis point decrease in the discount rate. 1. Using the multipoint curve drawing tool, draw a supply curve that illustrates equilibrium in the federal funds market before the policy action. Label this curve 'S₁'. 2. Using the multipoint curve drawing tool, illustrate what would happen in the federal funds market when the Fed lowers the federal funds rate by 75 basis points. Properly label your curve. After plotting the final point of your multipoint curve, press the Esc key on your keyboard to end the line. Carefully follow the instructions above, and only draw the required objects. Federal funds rate 4.75 4.25 4.00 3.50 D₁ Reserves

View Answer
divider
BEST MATCH

Expand f(x) = x2 , 0 < x < 2p, in a Fourier series, if the period is 2p. What is the value of f(x) at x= 0 and x = 2p? (b) From (a) prove that !!! " !!! # $ < < < < % < < = & & & & ! ! ! " ! ! #" ! $"# #" # & % !

View Answer
divider
BEST MATCH

Which of the following fat-soluble vitamins is associated with good vision? Group of answer choices Vitamin A Vitamin D Vitamin E Vitamin K

View Answer
divider
BEST MATCH

How many ways can six of the letters of the word ALGORITHM be selected and written in a row if the first two letters must be OR?

View Answer
divider
BEST MATCH

If a company purchases equipment costing $5,300 on credit, the effect on the accounting equation would be:

View Answer
divider
BEST MATCH

true or false: dividends are paid on the number of issued stock

View Answer
divider
BEST MATCH

PLC201: MICROECONOMIC/PRINCIPLE OF ECONOMICS ASSIGNMENT ANSWER ALL OUESTIONS Q1. What is utility, and how does the concept of marginal utility explain consumer satisfaction? Q2. From the following total utility schedule \begin{tabular}{|c|c|c|c|c|c|c|c|c|} \hline\( Q_{X} \) & 0 & 1 & 2 & 3 & 4 & 5 & 6 & 7 \\ \hline\( T U_{X} \) & 0 & 4 & 14 & 20 & 24 & 26 & 26 & 24 \\ \hline \end{tabular} i. Derive the marginal utility schedule. ii. Plot the total utility and the marginal utility schedule. iii. Find the saturation point. iv. Determine where the law of diminishing marginal utility begins to operate. Q3. Suppose an individual has an income of GHC 15 per time period, the price of good \( X \) is GHE 1 and the price of good \( Y \) is also GHE 1. That is, \( I= \) GHE 15, \( P_{X}= \) GHE 1 and \( P_{Y}=G H C 1 \). i. Write the equation of the budget line of this individual in the form that indicates that the amount spent on good \( X \) plus the amount spent on good \( Y \) equals the individual's income. ii. Write the equation of the budget line in the slope-intercept form. iii. Plot the budget line. Q4. The table below gives points on two different indifference curves for a consumer \begin{tabular}{|c|c|c|c|c|} \hline \multirow{2}{*}{ Combination } & \multicolumn{2}{|c|}{\( \boldsymbol{U}_{1} \)} & \multicolumn{2}{c|}{\( \boldsymbol{U}_{2} \)} \\ \cline { 2 - 5 } & \( \boldsymbol{Q}_{x} \) & \( \boldsymbol{Q}_{\boldsymbol{\gamma}} \) & \( \boldsymbol{Q}_{\boldsymbol{x}} \) & \( \boldsymbol{Q}_{\boldsymbol{\gamma}} \) \\ \hline\( A \) & 3 & 12 & 6 & 12 \\ \hline\( B \) & 4 & 7 & 7 & 9 \\ \hline\( C \) & 6 & 4 & 9 & 6 \\ \hline\( F \) & 9 & 2 & 12 & 4 \\ \hline\( G \) & 14 & 1 & 15 & 3 \\ \hline \end{tabular} i. Sketch the various indifference curves on the same set of axes. ii. What do the indifference curves show? iii. Find the \( M R S_{x y} \) between all the consecutive points.

View Answer
divider
BEST MATCH

Selenium is a(n) ________. ? atomic element ? molecular element ? ionic compound ? molecular compound

View Answer
divider
BEST MATCH

According to a study of the price elasticities of products sold in supermarkets, the price elasticity of demand for gummy bears is estimated at -0.45. Which of the following could explain why the price elasticity of demand for gummy bears is so low? Gummy bears are relatively inexpensive. There are few close substitutes for gummy bears. Gummy bears are considered a luxury good. The gummy bear industry is highly competitive.

View Answer
divider
BEST MATCH

Derive the least-squares fit of the following model: (35p) y = ax^2 + b + e (e is error) Fit the data with this model; \begin{tabular}{|c|c|c|c|c|c|c|} \hline X & -2 & -1 & 0 & 1 & 2 & 3 \\ \hline y & 0.2 & 0.8 & 1.4 & 2.7 & 4.1 & 6.1 \\ \hline \end{tabular}

View Answer
divider