Start Wireshark. The startup screen of the Wireshark displays the commands to use Wireshark.
Start capturing data by clicking on "Interface List" on the startup screen. In the Capture Interface dialog box,
click on Start to start capturing data.
At the command prompt, type ping XXX.XXX.XXX.XXX, and press Enter. Note that the xxx.xxx.xxx.xxx is the IP
address of Default Gateway (Ref. Lab1 for details). Observe the response on command prompt, you should
receive four replies
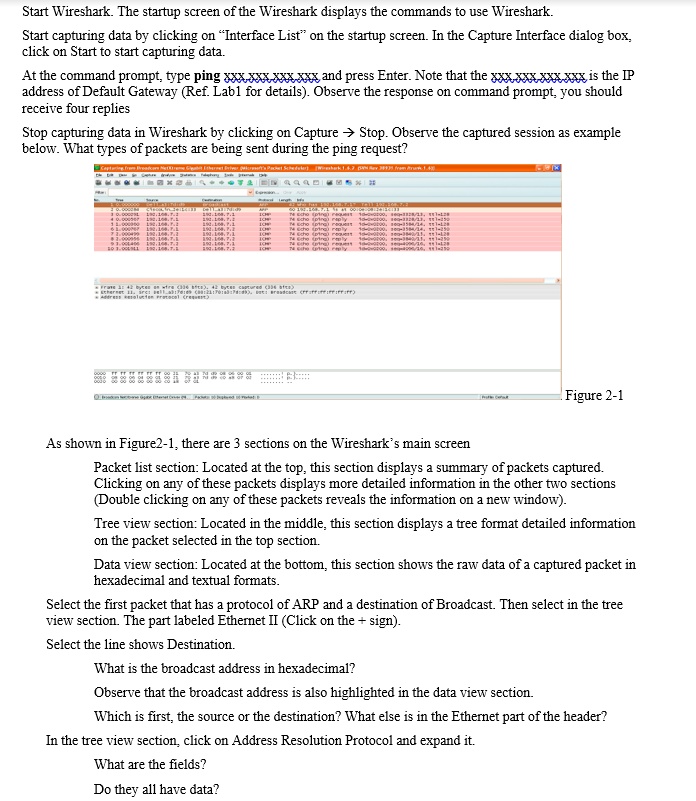
Stop capturing data in Wireshark by clicking on Capture ? Stop. Observe the captured session as example
below. What types of packets are being sent during the ping request?
Figure 2-1
As shown in Figure2-1, there are 3 sections on the Wireshark's main screen
Packet list section: Located at the top, this section displays a summary of packets captured.
Clicking on any of these packets displays more detailed information in the other two sections
(Double clicking on any of these packets reveals the information on a new window).
Tree view section: Located in the middle, this section displays a tree format detailed information
on the packet selected in the top section.
Data view section: Located at the bottom, this section shows the raw data of a captured packet in
hexadecimal and textual formats.
Select the first packet that has a protocol of ARP and a destination of Broadcast. Then select in the tree
view section. The part labeled Ethernet II (Click on the + sign).
Select the line shows Destination.
What is the broadcast address in hexadecimal?
Observe that the broadcast address is also highlighted in the data view section.
Which is first, the source or the destination? What else is in the Ethernet part of the header?
In the tree view section, click on Address Resolution Protocol and expand it.
What are the fields?
Do they all have data?