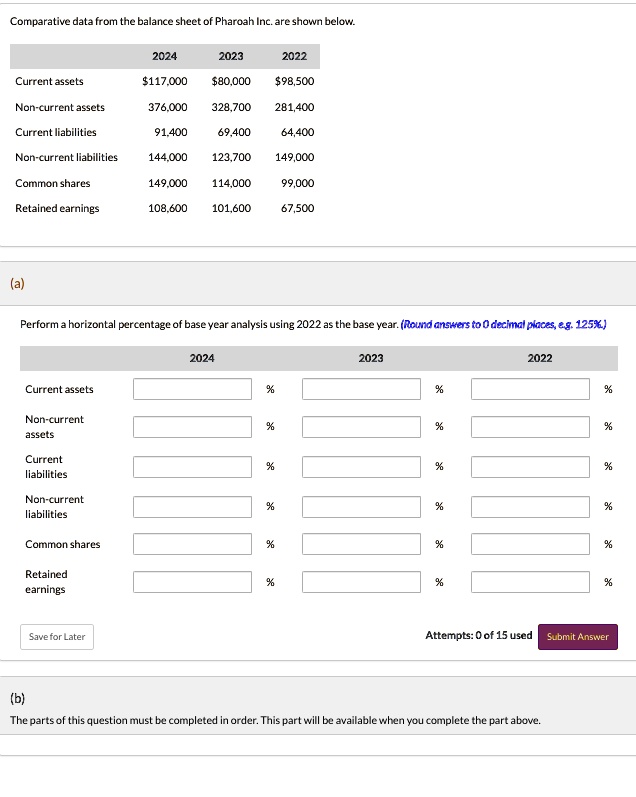
Comparative data from the balance sheet of Pharoah Inc. are shown below.
2024
2023
2022
Current assets
$117,000
$80,000
$98,500
Non-current assets
376,000
328,700
281,400
Current liabilities
91,400
69,400
64,400
Non-current liabilities
144,000
123,700
149,000
Common shares
149,000
114,000
99,000
Retained earnings
108,600
101,600
67,500
(a)
Perform a horizontal percentage of base year analysis using 2022 as the base year. (Round answers to 0 decimal places, e.g. 125%)
Current assets
Non-current
assets
2024
%
%
2023
%
%
2022
%
%
Current
%
%
%
liabilities
Non-current
%
%
%
liabilities
Common shares
%
%
%
Retained
%
%
%
earings
Save for Later
Attempts: 0 of 15 used
Submit Answer
(b)
The parts of this question must be completed in order. This part will be available when you complete the part above.