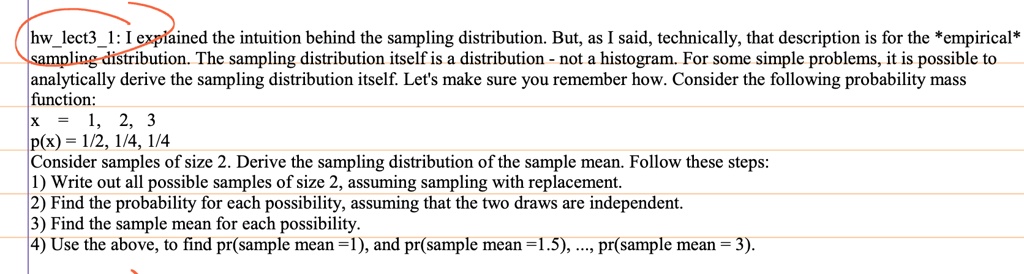
hw_lect3_1: I explained the intuition behind the sampling distribution. But, as I said, technically, that description is for the *empirical* sampling distribution. The sampling distribution itself is a distribution - not a histogram. For some simple problems, it is possible to analytically derive the sampling distribution itself. Let's make sure you remember how. Consider the following probability mass function:
X = 1, 2, 3
p(x) = 1/2, 1/4, 1/4
Consider samples of size 2. Derive the sampling distribution of the sample mean. Follow these steps:
1) Write out all possible samples of size 2, assuming sampling with replacement.
2) Find the probability for each possibility, assuming that the two draws are independent.
3) Find the sample mean for each possibility.
4) Use the above, to find pr(sample mean =1), and pr(sample mean =1.5), ..., pr(sample mean = 3).